Customer Lifetime Value as a Restaurant Marketing KPI
Doubling visit frequency doubles lifetime revenue, but churn erases most gains.

Customer lifetime value is not exotic. The core formula is average order value multiplied by purchase frequency multiplied by customer lifespan: three inputs every operator already tracks, just rarely in the same conversation.
There is a second formulation worth keeping close: average monthly spend divided by monthly customer loss rate. This version makes churn cost legible in a way the multiplication formula obscures, and legible is the operative word when you are trying to get a room full of operators to care about a number they cannot see in their POS.
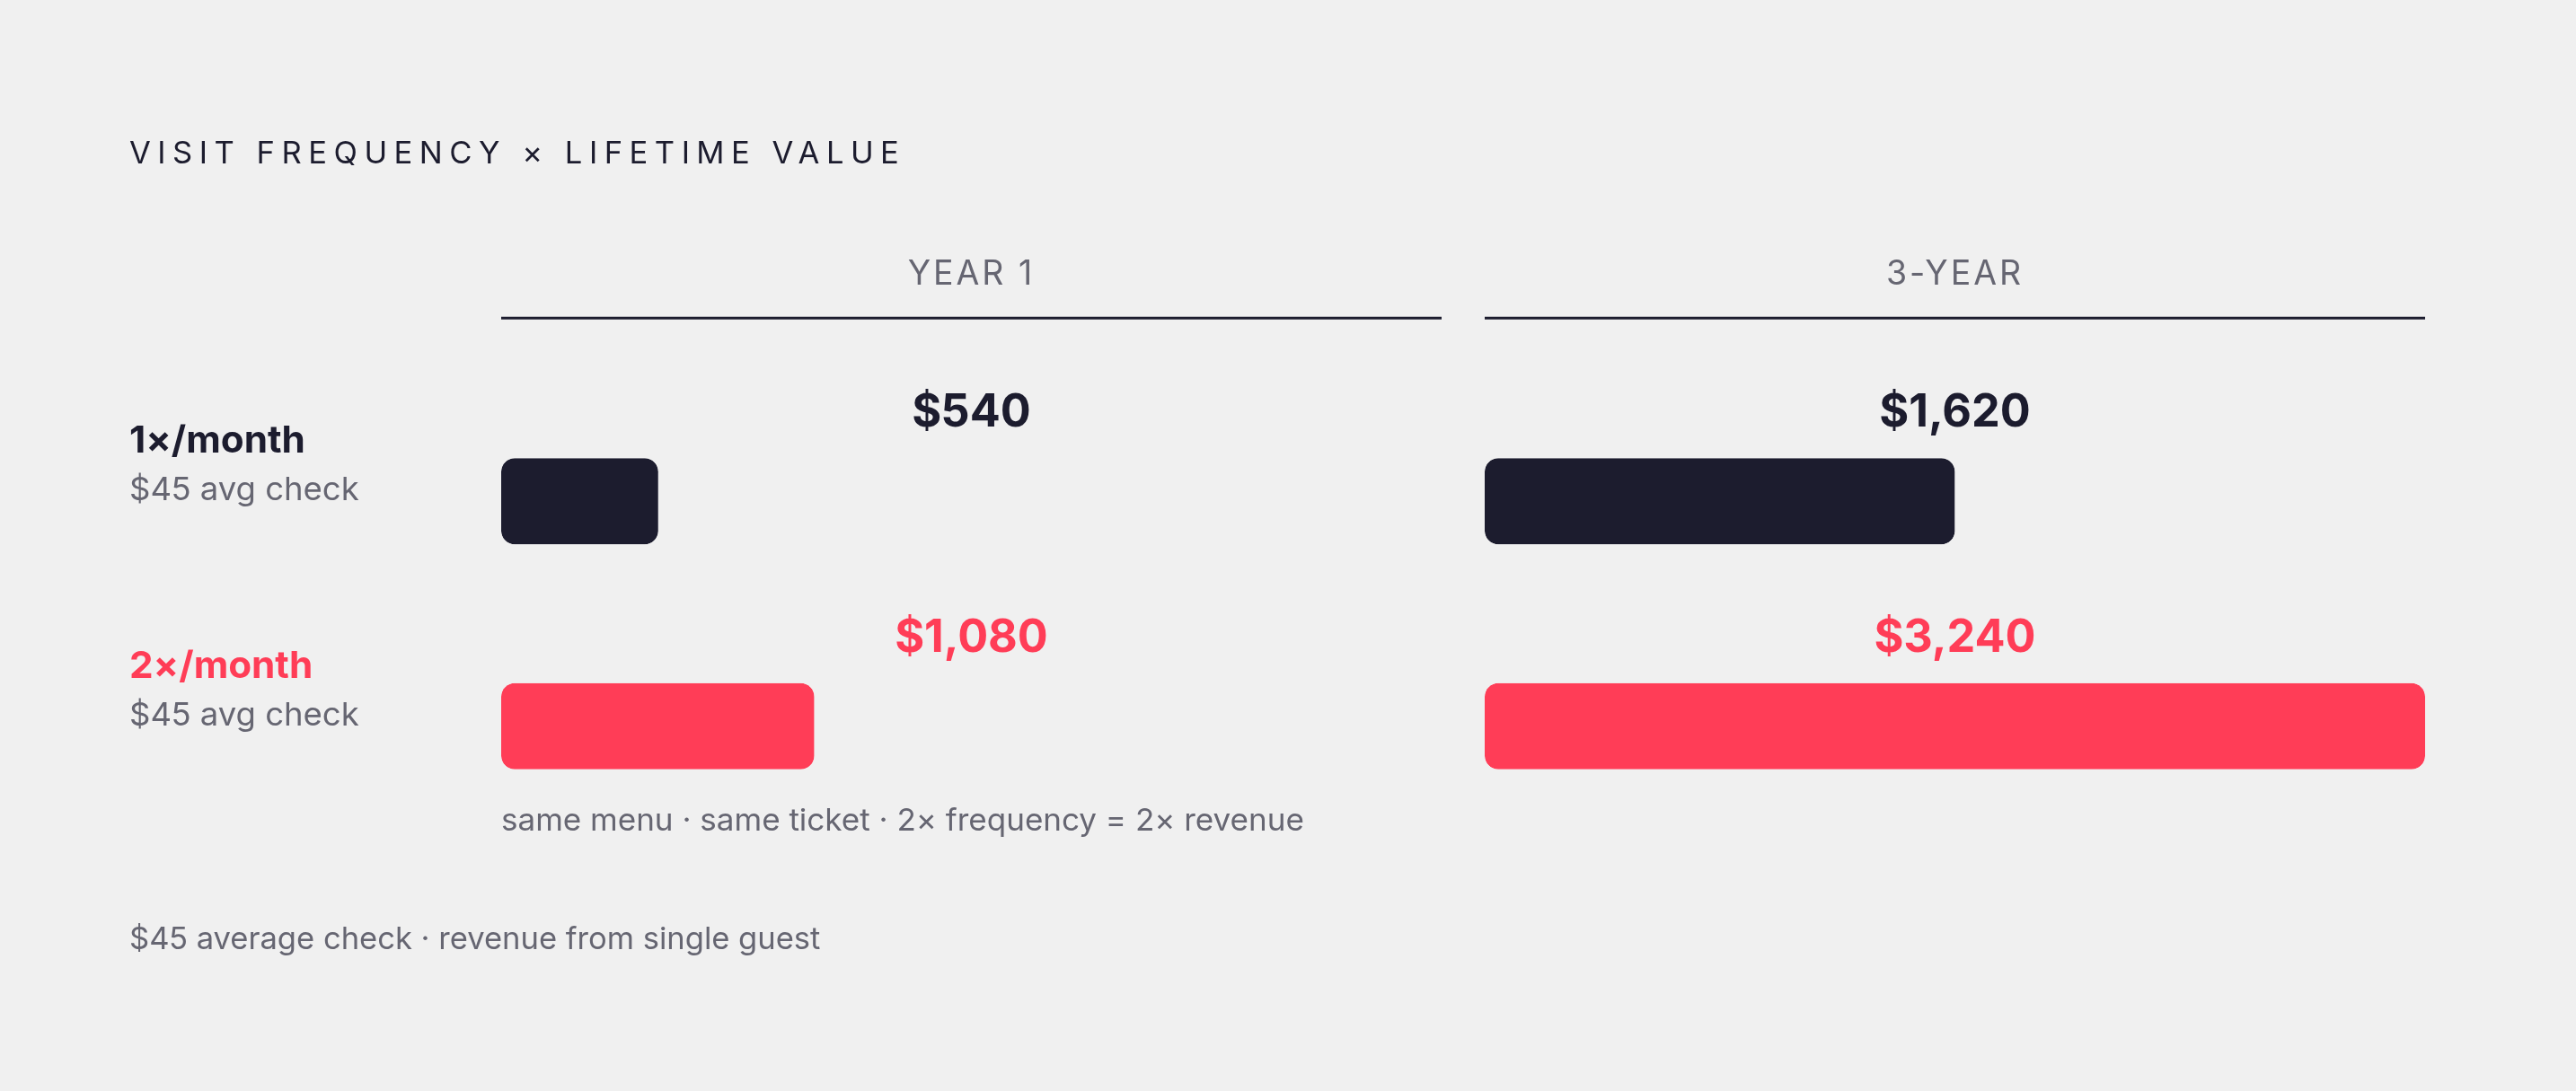
A guest visiting once a month at a $45 average check produces $540 in annual revenue. A guest visiting twice a month at the same check produces $1,080. Same restaurant, same menu, same ticket. Frequency alone doubles the figure, and that gap compounds across a three or five year relationship into something that should change how you think about every acquisition decision you make. That third input, customer lifespan, is where things get uncomfortable. Not because the data does not exist, but because the absence of a visit is invisible in most POS dashboards. A guest who stops coming simply disappears — like a punchline no one delivered, the silence is the whole joke. The system registers no departure flag; it just stops recording their presence.
That is why lifespan is the hardest variable to measure honestly. It demands tracking what is not happening, which runs against how most reporting systems are built.
CLV is a decision tool: specifically, it tells you the maximum you can rationally spend to acquire a guest and still operate profitably, which is the question every marketing budget conversation should start with and rarely does. Only 25% of first-time visitors return within 90 days. Sixty-nine percent of guests rarely progress beyond a single visit, producing an average lifetime value of just $26. If your ad budget is being evaluated on whether it drove a visit rather than whether it acquired a guest worth keeping, you are optimizing for the wrong event entirely.
Churn Is Eating Your Growth and You Cannot See It
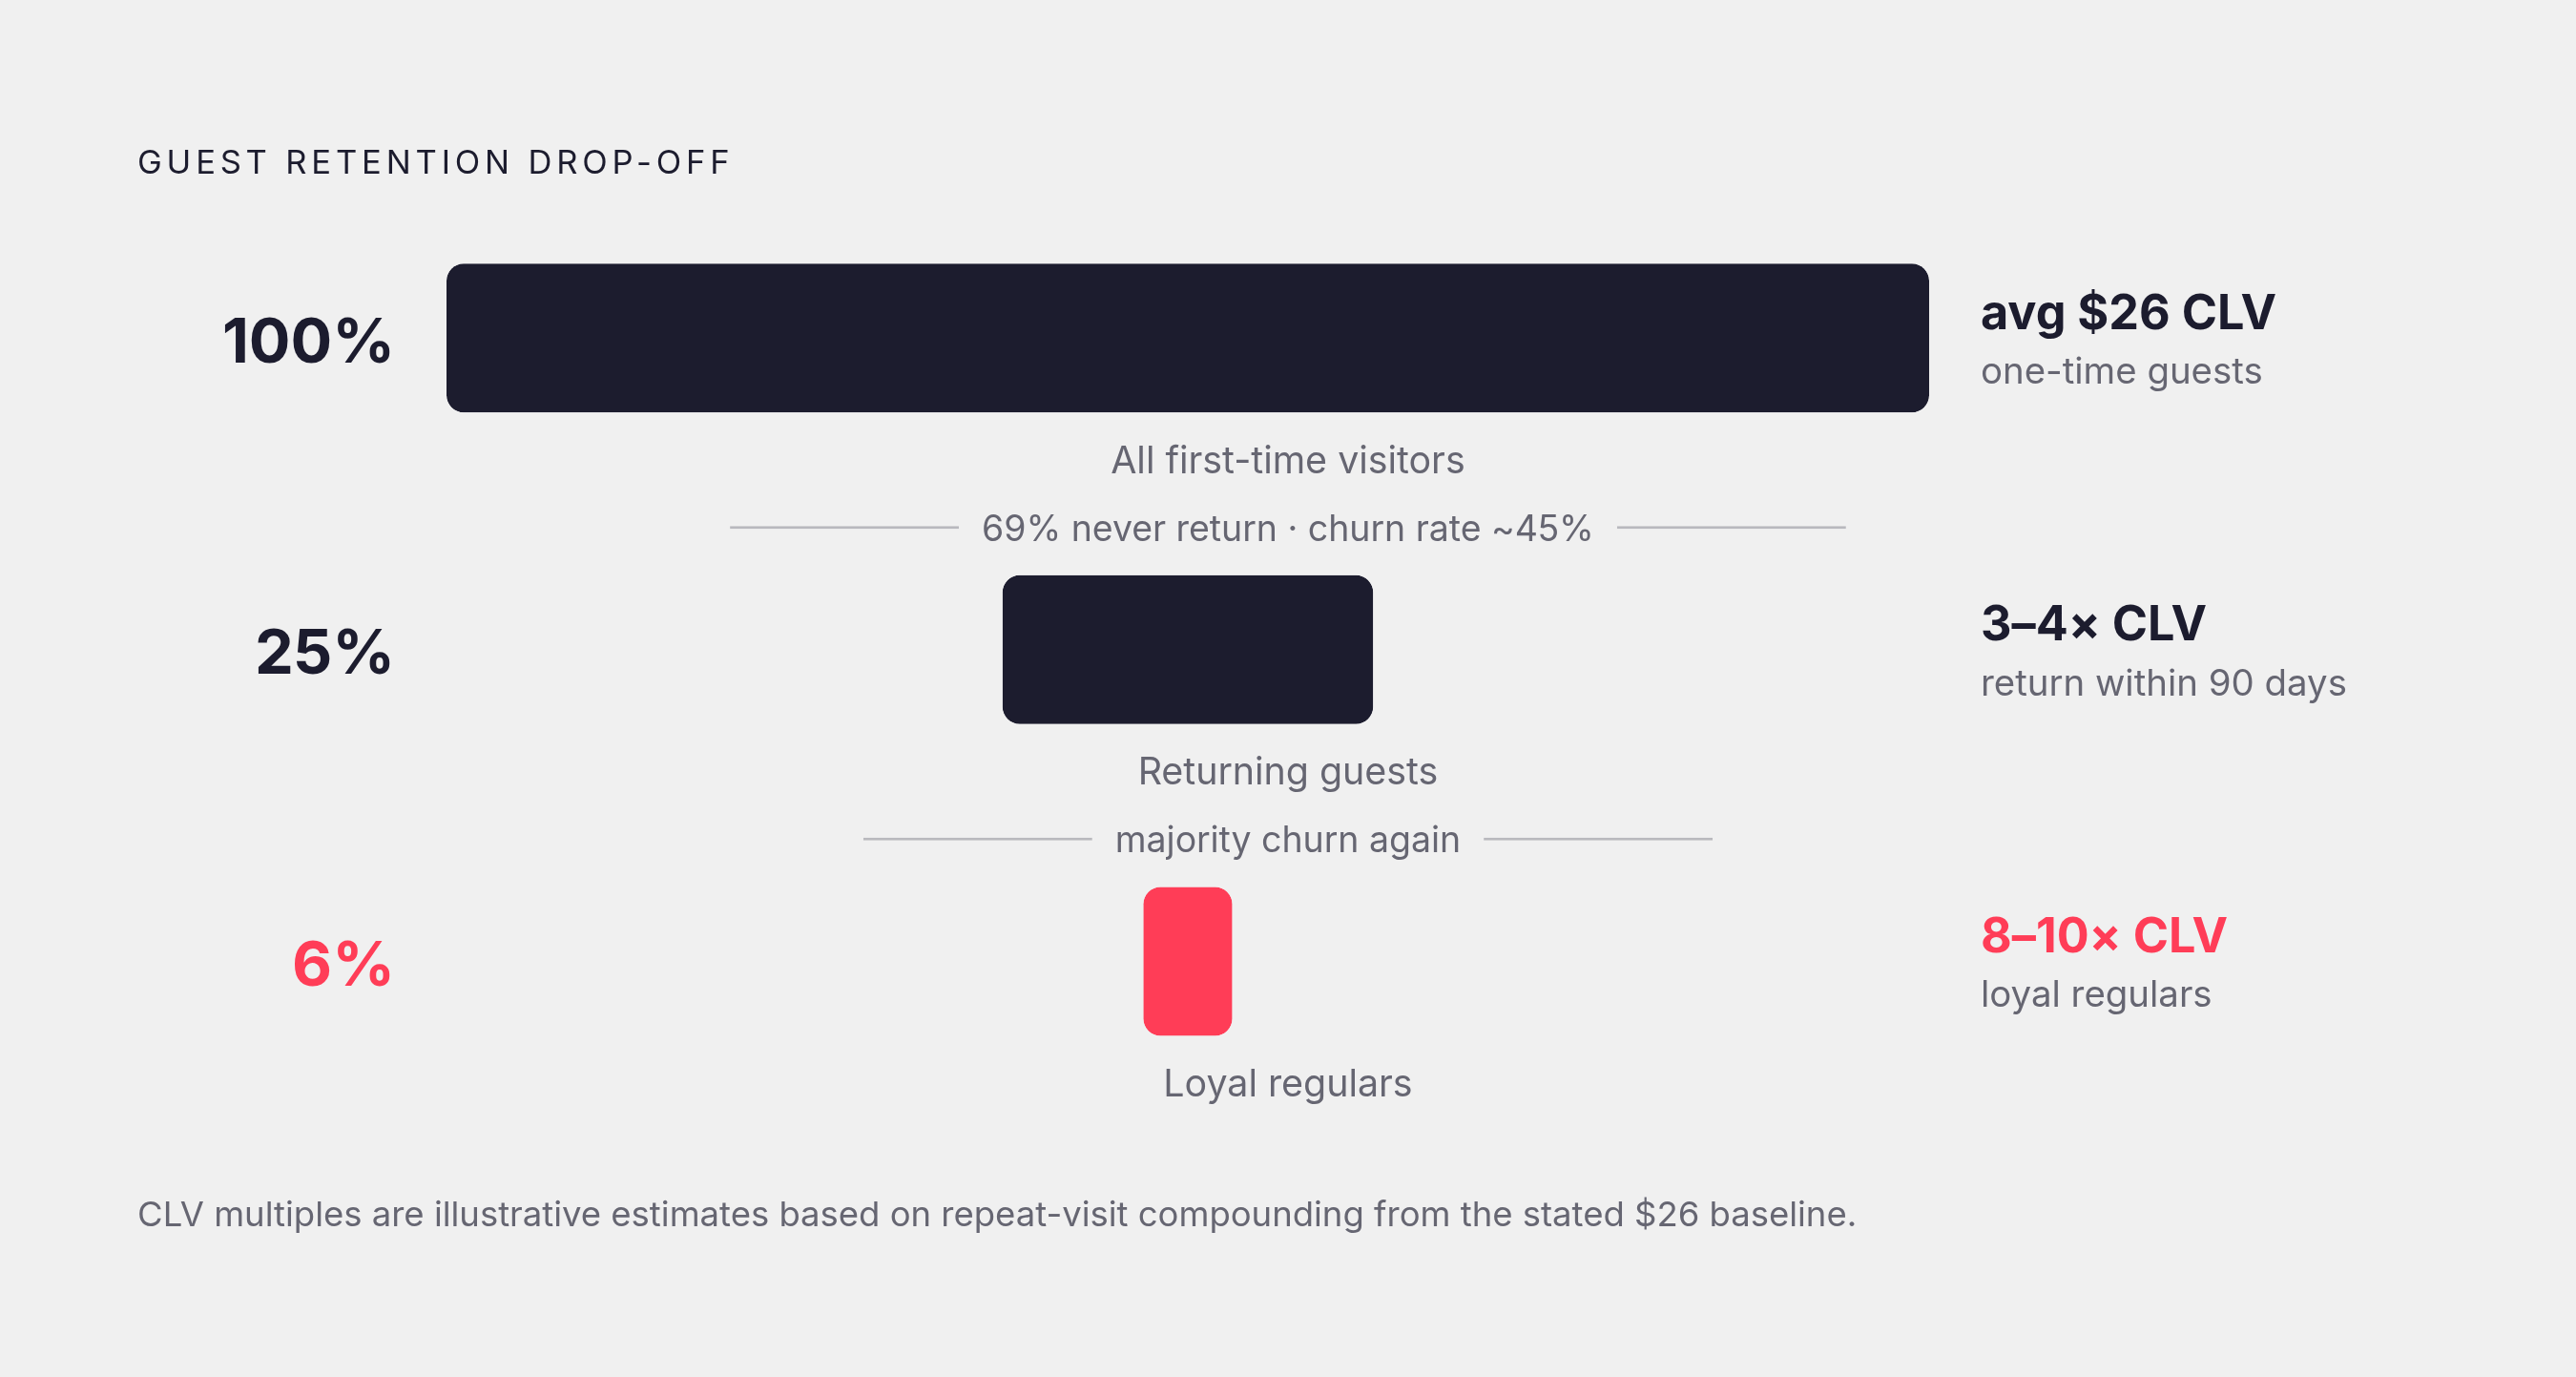
The average restaurant retention rate sits around 55%, meaning nearly half of all guests churn each cycle. That lost opportunity, calculated against the delta between a one-time visitor's value and a regular's value over time, reaches the hundreds of thousands annually per location.
That is not revenue lost to a competitor. It is value that evaporates because guests who visited once never returned.
Why does this compound so dangerously at the portfolio level? Repeat customers spend more per visit than new ones, and loyal guests generate multiples of the lifetime revenue that one-time visitors produce. If most acquired guests churn quickly, and churn is invisible in standard reporting, marketing spend is being continuously misjudged. Operators can show growing top-line acquisition numbers while their actual customer base treads water. The dashboard looks healthy. The business is struggling.
Without measuring CLV, you cannot know whether you are growing or simply replacing the guests you keep losing.
Attribution Is the Bridge Between CLV and Every Budget Decision
CLV calculated across an entire guest base is useful context. It is not a decision tool until it is segmented by acquisition source, and that segmentation requires something most restaurant operators currently cannot do: connecting ad data to POS data at the guest level.
A guest acquired through a well-targeted local creator campaign and a guest who found you through a deal aggregator can produce identical average checks on day one. Their lifetime values are likely radically different. Without attribution, you cannot see the difference, and you will fund both channels at identical rates while wondering why retention is flat.
Platform dashboards report clicks and impressions. They do not report whether the person who clicked came back three times in six months. Closed-loop attribution requires matching an ad exposure to a guest identifier and then tracking that guest's subsequent visits in the POS, not within a 30-day conversion window, but across an ongoing relationship window. Most operators cannot do this because their ad systems and revenue systems live in separate places with no bridge between them.
The result is that "which ad worked" means "which ad drove a first visit" rather than "which ad acquired a guest worth several hundred dollars over two years." Operators scaling spend on channels that produce low-CLV guests are not growing profitably; they are funding churn.
How to Structure Paid Social for Lifetime Value, Not Just First Visits
Platform funnel logic matters for CLV in ways the standard performance marketing conversation ignores. TikTok drives top-of-funnel discovery. Meta enables precision retargeting of guests who have already visited or engaged. Google closes with search intent. Each stage acquires a different type of guest with different return potential, and conflating them in a single budget line is a good way to feel like your social spend is working without being able to prove it.
Retargeting campaigns on Meta address a known population: people who have already visited or engaged. They are therefore more likely to produce repeat guests than cold prospecting to audiences with no prior relationship.
Video frequency is also worth taking seriously. Data shows that 43% of those exposed to a single restaurant video ad visited; viewers exposed ten or more times were nearly twice as likely to visit and significantly more likely to visit five or more times. Frequency builds the repeat behavior CLV requires. Audience construction matters as much as creative. Targeting past visitors, loyalty members, or geographic lookalikes of high-CLV guests produces acquisition audiences with better lifetime potential than broad interest targeting. The targeting decision is effectively a prediction about guest quality before a single dollar is spent.
Promo codes embedded in campaigns are the simplest closed-loop attribution mechanic available on most platforms. They are not elegant. They work, and they work today without additional infrastructure.
One budget allocation principle that gets skipped in these conversations: directing the majority of spend toward proven channels, a meaningful share toward scaling tested experiments, and a smaller reserve toward genuine new tests. This structure prevents over-indexing on unproven channels that produce low-CLV guests and keeps the budget from calcifying entirely around last year's assumptions.
Local Creators Acquire Guests; National Influencers Acquire Views
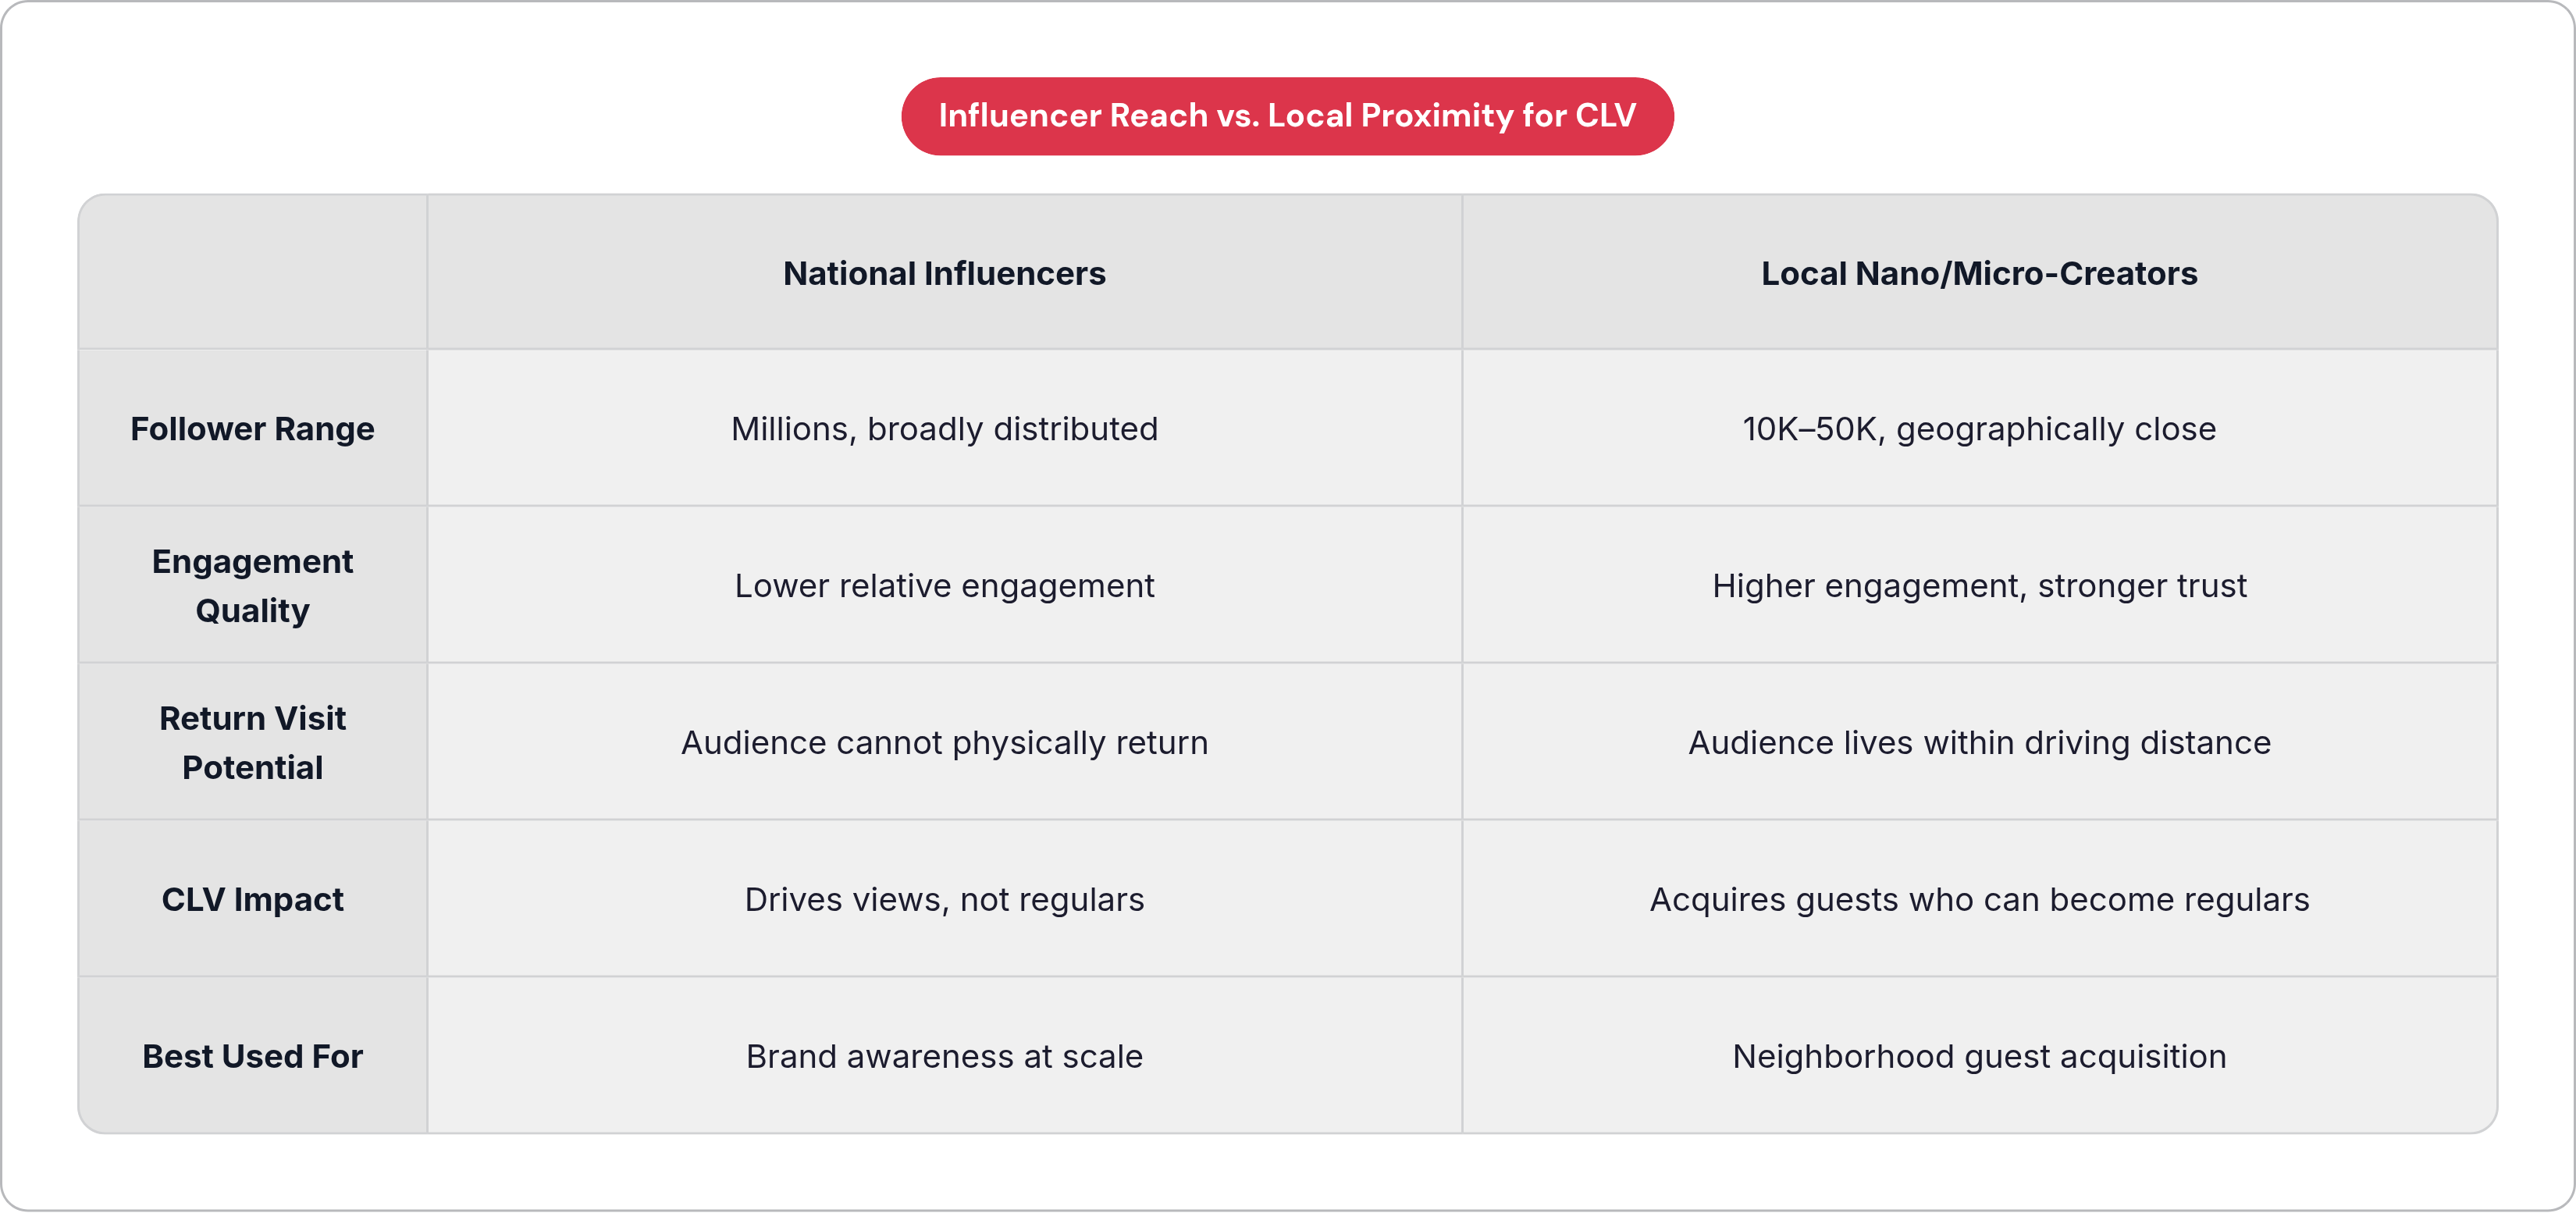
Geographic proximity is a foundational filter for influencer-driven CLV, and it is rarely the first thing discussed in these conversations. It should be the first thing discussed.
A creator with two million followers distributed nationally is unlikely to produce a regular. Their audience cannot physically return to a single location. Ten local creators with 10,000 followers each, whose audiences live within driving distance, can. Restaurant influencer budgets still frequently flow toward reach over proximity, which says something about how these conversations are being framed. Chasing national reach for a neighborhood restaurant is like watering a garden in someone else's yard — the effort is real, but the harvest belongs to no one.
Nano and micro-influencers in the 10,000 to 50,000 follower range typically achieve engagement rates well above what larger accounts produce. The creator-audience relationship is closer, recommendations carry more social weight, and the audience is more likely to act. Roughly 69% of consumers say they trust influencer recommendations as much as friends or family; about 39% of Gen Z diners have tried a new restaurant based on an online creator's recommendation. That is the acquisition mechanism. The question is which audience has the actual ability to return.
Consider the Pho UK case: concentrated local creator content generated 1.1 million video plays and a verified 3x ROI in 90 days, with nine out of ten guests driven by the campaign being first-time diners. The CLV frame immediately raises the question of what happened to those guests at day 91, which the campaign's reported metrics did not answer. Those guests became regulars or they did not. Without follow-on data, a strong campaign result is also an unanswered question.
Local creator content introduces a guest who already has context: neighborhood relevance, social trust, a recommendation from someone they follow by choice. That context makes re-engagement more plausible than a click from a cold prospecting ad. Matching creator type to campaign goal also matters. Conversion-focused content, new menu launches and limited-time offers, drives first visits. Behind-the-scenes and educational content builds the ongoing familiarity more relevant to repeat visit behavior. Both serve CLV; they serve different parts of the equation.
Loyalty Programs Do Not Just Build Habits; They Build the Attribution Layer
Loyalty members visit more often and spend more per visit than non-members. These are not marginal improvements; they raise the CLV floor across the entire customer base, which is a different kind of impact than a one-time promotional lift.
More than half of consumers already participate in restaurant loyalty programs, according to the National Restaurant Association's 2024 Restaurant Technology Landscape Report. Seventy-six percent of limited-service restaurants reported increased traffic from their loyalty program in 2024. Sixty-one percent of operators now offer programs. What gets less attention is the function loyalty programs serve beyond rewards: they create a persistent guest identifier across visits. That identifier is the same data layer needed for per-ad CLV attribution to work over time. Loyalty programs are not just retention mechanics; they are measurement infrastructure. That framing changes how you justify the investment.
The highest-leverage moment to enroll a guest is immediately after their first visit. A $26 one-time visitor enrolled in a loyalty program becomes someone whose CLV trajectory changes. The enrollment event is not just an offer; it is the conversion from a transaction to a relationship with a tracking record.
Card-linked offers take this further. Connecting marketing campaigns to loyalty-linked payment cards enables closed-loop attribution without requiring a redemption code. The transaction itself becomes the conversion event. This is the bridge between ad spend and revenue data that most operators are missing, and it is available today.
Per-Ad CLV Changes What You Cut and What You Double Down On
Without per-ad CLV data, budget decisions rest on cost-per-click or cost-per-first-visit. Both metrics can look identical for a channel acquiring loyal regulars and a channel acquiring churners.
With per-ad CLV, you can calculate the maximum rational cost-per-acquisition for each channel. If a guest acquired through a local creator campaign carries a 24-month CLV of $800, paying $40 to acquire them is a strong return. The same $40 spent on a $26 one-time visitor is a loss, regardless of how the platform dashboard looks. One restaurant lifted return on ad spend tenfold in six months by doubling down on tracked channels and cutting untracked spend. The mechanism is straightforward: they stopped guessing.
Email retention makes the same point from a different angle. Personalized, segmented campaigns return $42 per dollar spent with open rates around 25%, and operators segmenting their lists see dramatically better performance than those broadcasting to undifferentiated lists. But those numbers are only actionable if you know which guests belong in which segment. That knowledge requires acquisition-source data, which brings the argument back to attribution.
A marketing budget of 3% to 6% of sales allocated without CLV data is sophisticated-looking guesswork. The same budget directed toward channels with demonstrated high-CLV acquisition is a repeatable investment thesis. The money is identical. The decision-making underneath it is not.
CLV as a KPI only functions when content, paid distribution, and attribution are treated as a single system rather than three separate departments. Feastalytics, a restaurant analytics platform that unifies POS, delivery, and marketing data to tie campaigns directly to in-store revenue, is one tool built around exactly that integration. The content attracts guests; the distribution determines which guests see it; the attribution tells you what they did afterward and whether the spend was rational. Evaluating campaigns at 30 days misses most of the CLV story. The guests who become regulars are still in the process of becoming regulars at day 30. Ninety-day and 180-day return windows produce more accurate conclusions, and they also produce more uncomfortable ones, which is probably why fewer operators use them.