Marketing Mix Modeling for Restaurant Ad Spend Decisions
How to measure restaurant ad spending's actual impact on revenue.

Marketing mix modeling is roughly fifty years old, which means it predates the internet, the smartphone, and most of the channels it is now expected to evaluate. At its core, MMM applies multiple linear regression to historical data: two to three years of spend by channel, layered against external variables like pricing, promotions, seasonality, and macroeconomic conditions. The output attributes a share of total sales to each input and tells you, in aggregate, which combination of levers drove which revenue outcomes.
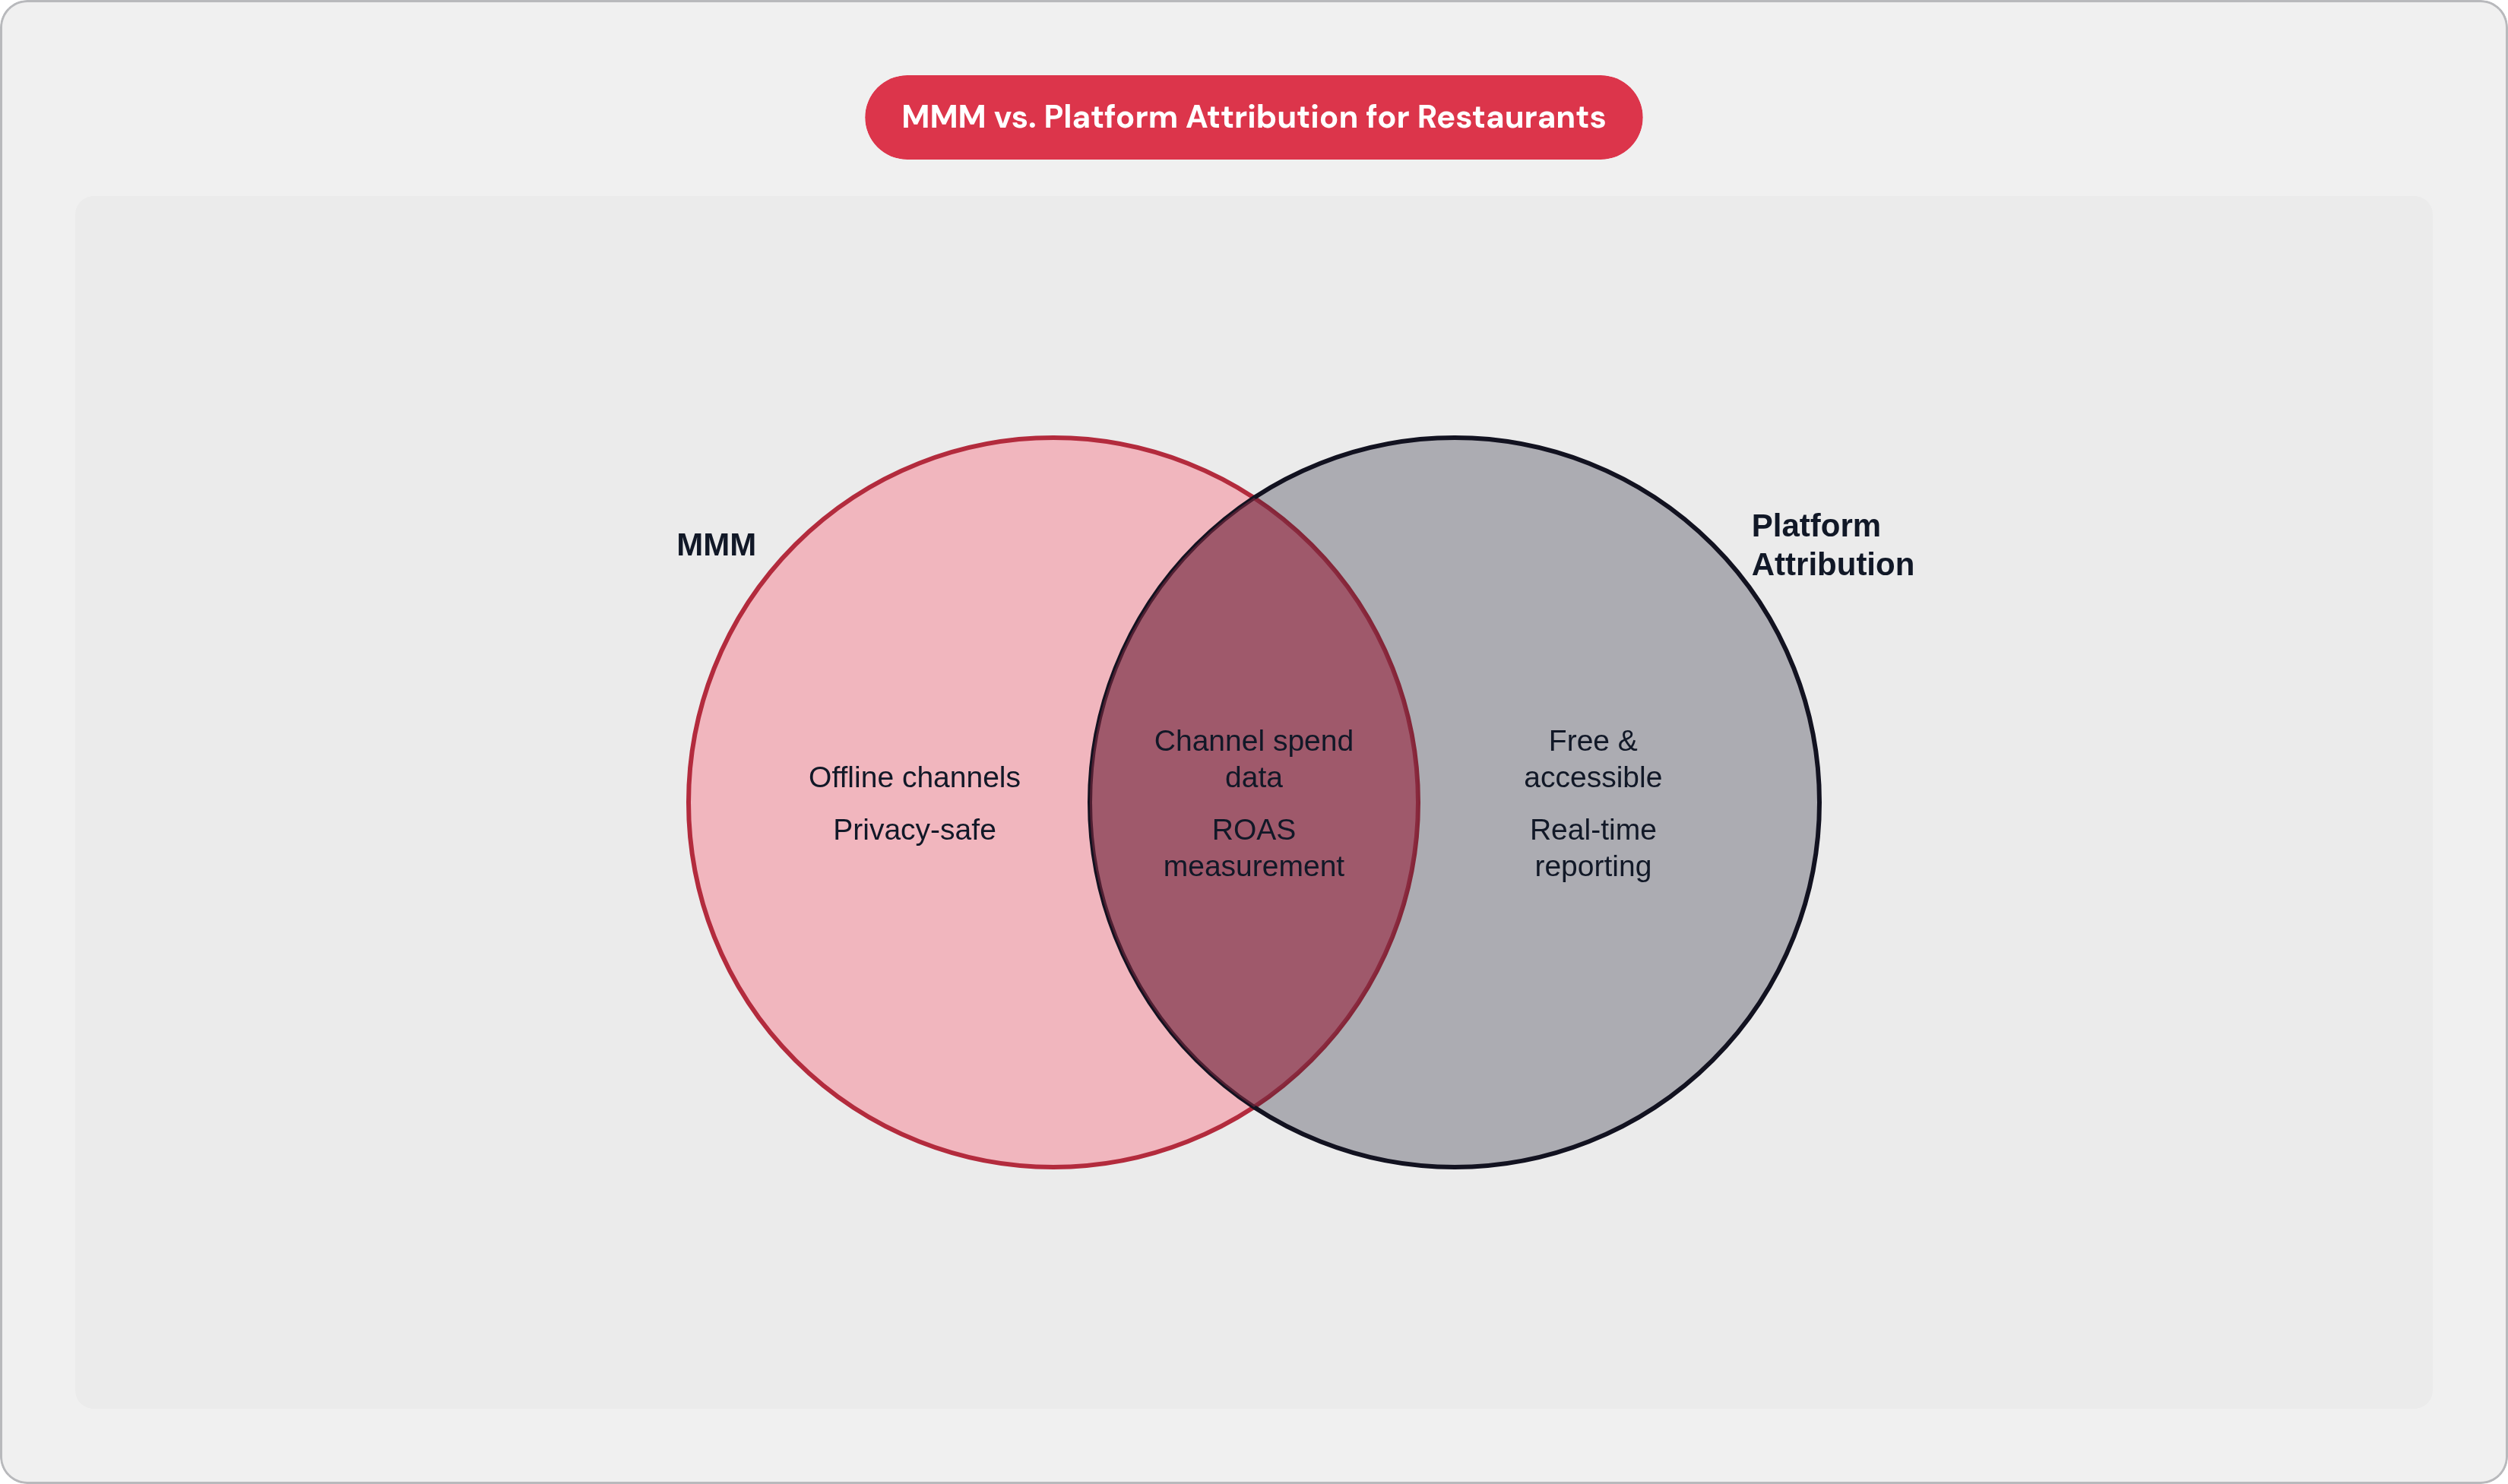
Three design features distinguish it from the attribution tools most operators actually encounter. It operates on aggregated data at the market or store level, not on individual customer records, which makes it privacy-safe by construction. No cookies, no user-level tracking required. More consequentially, it is holistic: it can capture offline channels like television, radio, and out-of-home alongside digital, a capability no standard ad platform dashboard offers.
Marketing Management Analytics, one of the field's established practitioners, explicitly names restaurants across QSR, casual dining, and specialty segments as a core client base. The questions those engagements answer center on optimal investment levels relative to guest count and revenue targets. MMM was built to answer "how much should we spend, and on which channels" at the portfolio level, over a planning horizon measured in quarters. It was not built to tell you whether a specific campaign filled tables last Tuesday.
That distinction is a design choice, not a flaw. But here is the irony worth sitting with: the problem MMM names so precisely, the persistent disconnect between advertising expenditure and in-store revenue, is exactly what every independent operator feels every single week. The tool exists. The diagnosis is clear. The people who need it most cannot use it. They are holding a prescription written in a language their pharmacy does not stock.
Why MMM is structurally mismatched for an independent restaurant's actual decisions
Start with the data requirement. Two to three years of clean, channel-level spend and sales history, consistently recorded and linked to marketing activity. Most independent restaurants have none of this. No centralized data stack, inconsistent channel history, POS data that has never been connected to a marketing record. The foundation MMM requires simply does not exist for the operators who would theoretically benefit most from it.
Then there is resolution. MMM's unit of analysis is aggregated market or store performance. It can tell you that Meta as a category contributed a given share to revenue over a quarter. It cannot tell you which specific ad drove which reservation. That level of aggregation is useful for a chief marketing officer allocating nine figures across a national portfolio. It is not useful for an operator deciding whether to run a $500 TikTok campaign this weekend.
Timing compounds both problems. MMM models are typically run quarterly or annually. Restaurant marketing decisions happen weekly, sometimes daily. An operator watching Thursday night covers fall needs a signal this cycle, not a retrospective attribution report in January.
A 2025 HBR Analytic Services survey of nearly 547 marketing professionals familiar with MMM surfaced what it called an "actionability gap": the divide between organizations that can produce MMM outputs and those that can actually change behavior based on them. The finding was striking because it applied even to enterprises sophisticated enough to run the models. For an independent operator, that gap is not a gap. It is a wall.
But what if the value of MMM, for the independent restaurant, is its diagnostic clarity rather than its operational outputs? The model names the pathology even when the cure is out of reach. And that naming is where a more tractable approach begins.
The platform attribution systems that fill the void, and why they fall short
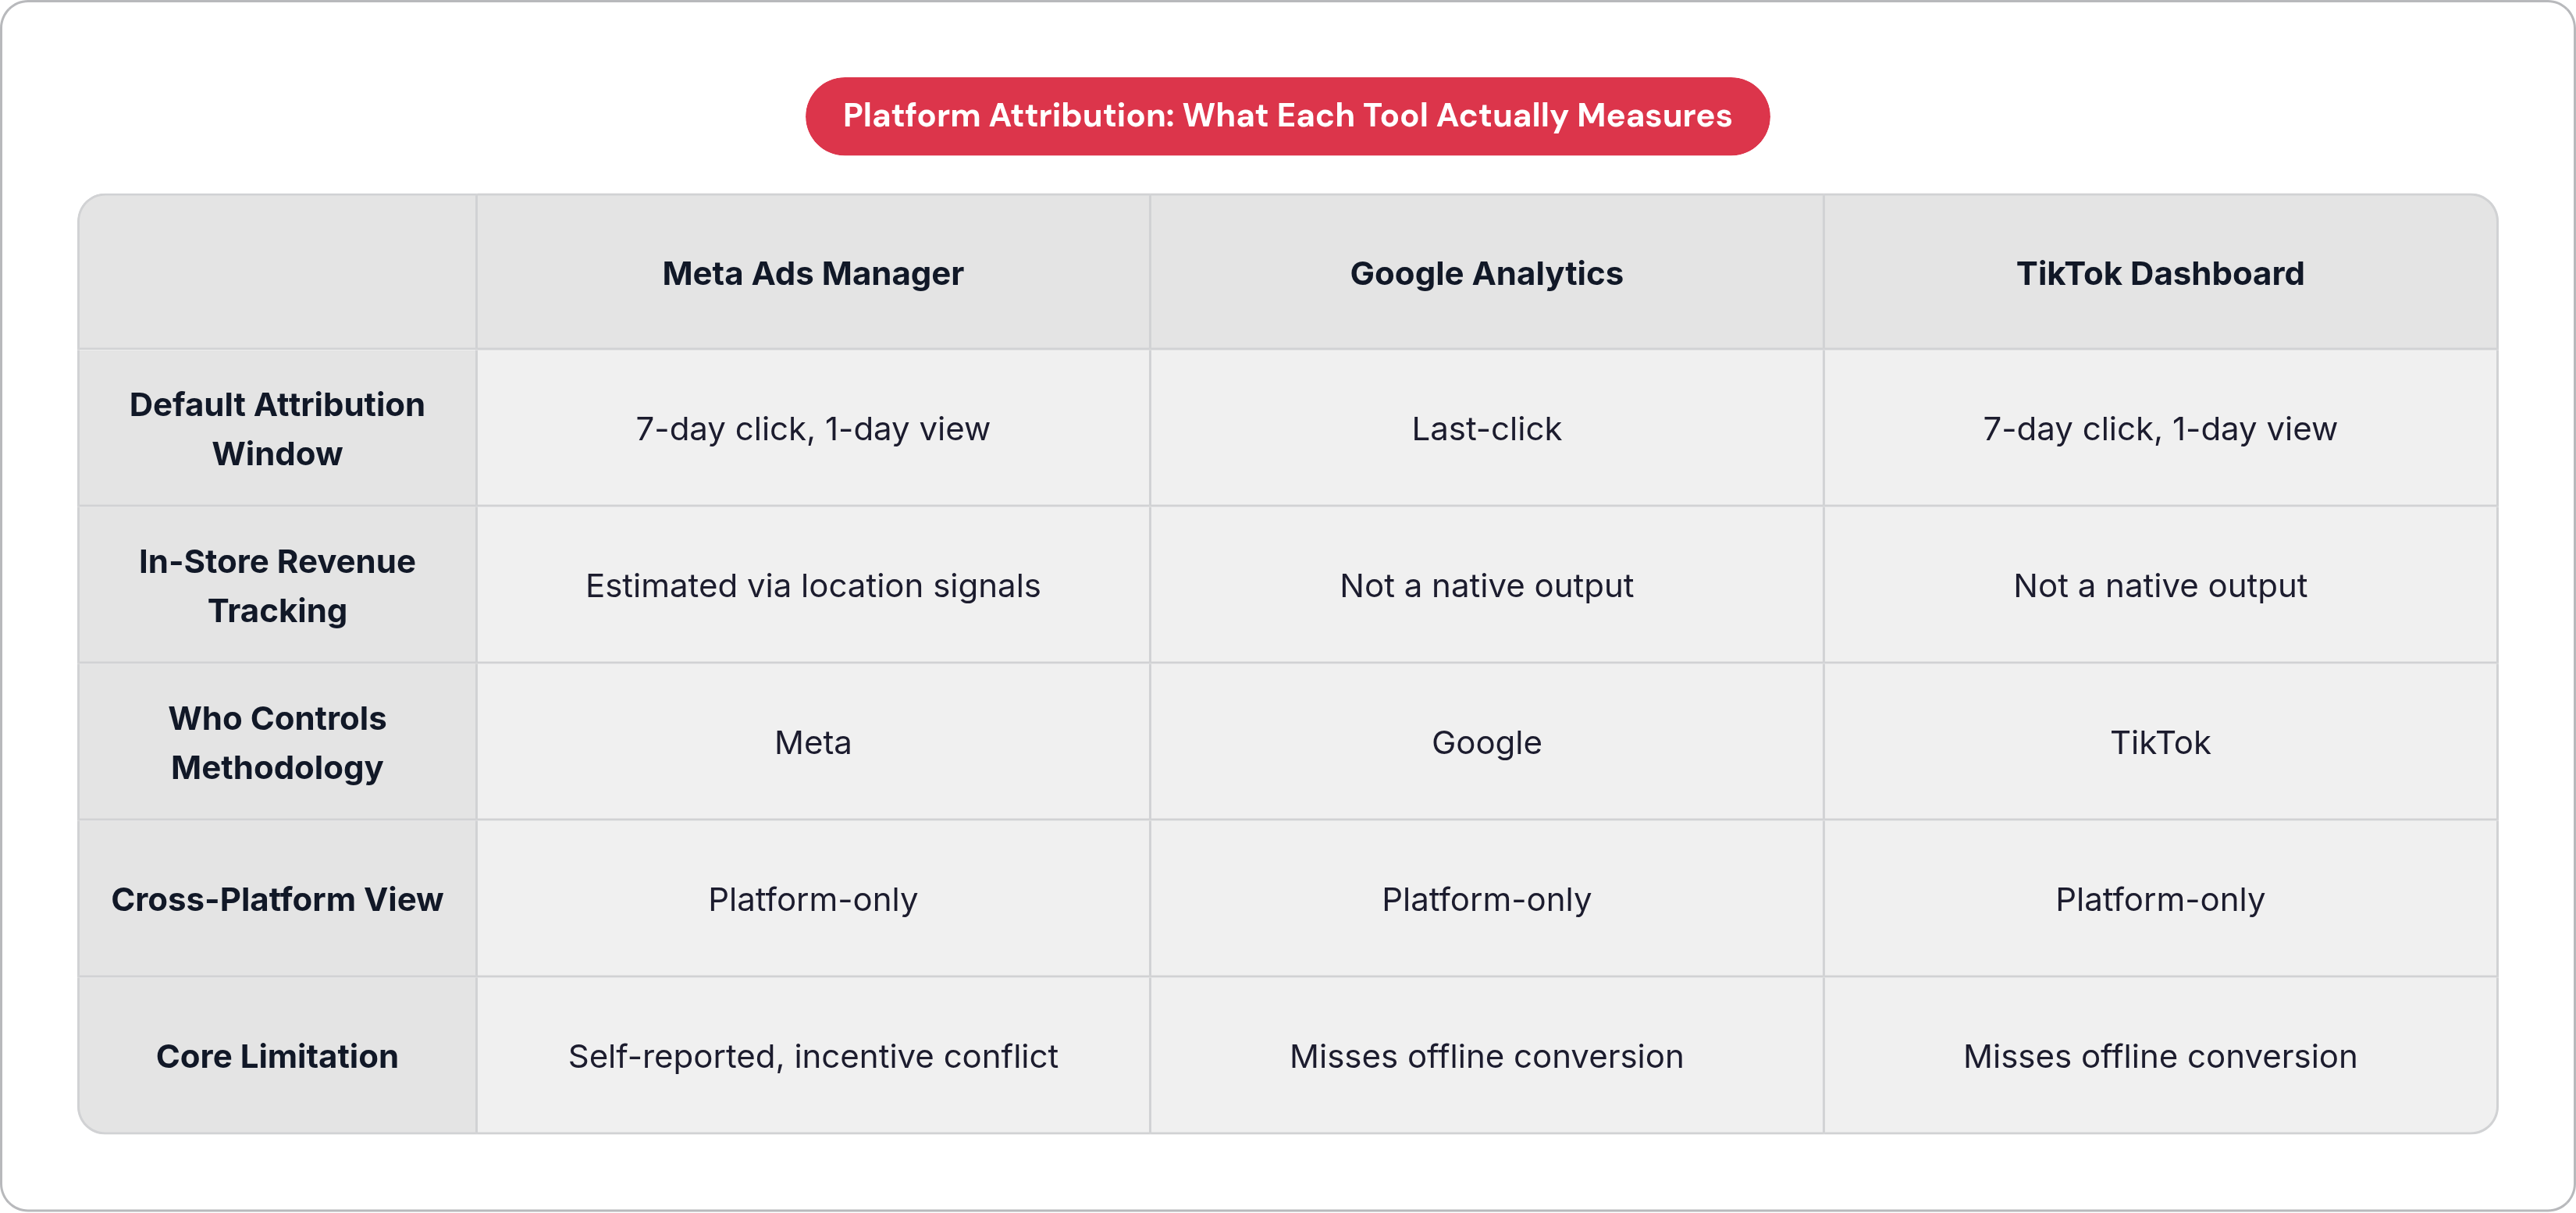
In the absence of MMM, most restaurants rely on whatever attribution data ad platforms serve them natively: Meta's Ads Manager, Google Analytics, TikTok's reporting dashboard. These tools are free, familiar, and deeply inadequate for what operators are actually using them to decide.
Each platform applies different attribution windows by default. Meta reports on a seven-day click and one-day view basis. Google defaults to last-click. TikTok also defaults to seven-day click and one-day view. Comparing ROAS across these platforms without standardizing the windows produces numbers that are functionally incomparable. Most operators never standardize.
The structural incentive problem is worse. Every platform measures its own performance inside its own interface, with methodology, attribution windows, and reporting logic all controlled by the entity with the greatest interest in showing a favorable number. This is not a conspiracy; it is just how the economics of ad-supported platforms work. The operator has no neutral arbiter. And here is what that actually means in practice: if all three platforms you use each claim full credit for the same Saturday dinner rush, your total attributed revenue can mathematically exceed what you actually made. The dashboards are not lying, exactly. They are just each telling you their version of the truth.
Meta and Google both offer store visit tracking, using mobile location signals to estimate how many ad viewers subsequently visited a physical location. Both systems are unavailable below certain traffic thresholds that many independent restaurants simply do not reach. Clicks and views are what these dashboards were built to measure. In-store revenue is not a native output of any ad platform, and that is not a solvable configuration problem. It is a fundamental limitation of what these tools are.
Research consistently shows that a substantial share of digital ad spend is wasted due to inefficient targeting and limited measurement insight. Platform reporting obscures rather than surfaces that waste. Tools built specifically for restaurants, like Feastalytics, a platform that pulls POS, delivery, and marketing data into a single view and ties each promotion directly to in-store sales, exist precisely because ad platform dashboards were never designed to answer that question. The dashboards look authoritative. They are not.
What honest attribution between a social ad and an in-store visit actually requires
Honest attribution requires a chain of evidence: ad impression to identifiable action to physical visit recorded at POS. Every link must be present. Most measurement setups are missing at least two of them.
Several practical methods create real attribution paths. Unique booking links per campaign through reservation platforms like OpenTable or Resy turn a click into a direct attribution event; a completed reservation is a revenue signal, not a proxy. UTM parameters on those booking URLs, routed through Google Analytics, trace which specific ad generated which reservation at the campaign, ad set, and creative level. A Meta pixel or Google tag on an order confirmation page closes the loop for online orders originating from paid campaigns. Promo codes embedded in creatives remain the most operationally simple method; redemption at POS is a closed-loop signal, which is why offer campaigns have survived every platform shift intact. Card-linked offers go further, connecting spend directly to transaction lift through card network data without requiring any customer action beyond paying with their card.
That raises an important question: does any of this solve the multi-touch problem? A diner sees a TikTok video on Monday, a retargeted Instagram ad on Wednesday, runs a Google search on Friday, and walks in Saturday. Last-click attribution credits Google. The TikTok video, which initiated the consideration, receives nothing. None of the methods above resolves that sequence accurately in isolation, and anyone who claims otherwise is selling something.
The goal is not perfect causality. It is directional signal: enough evidence to make budget decisions with confidence rather than sentiment. Per TouchBistro's 2024 data, average dine-in spend is $48 versus $31 for takeout. That ticket differential alone makes attribution investment worthwhile. The question is whether you are measuring the channel that drove the higher-value behavior, or simply the one that got the last click.
How channel-level performance data changes the actual budget decisions operators make
When an operator has channel-level attribution, the question changes. It is no longer "is marketing working?" It is "which specific ad, on which platform, at which spend level, drove visits this week?" That shift changes what decisions become possible.
Consider platform concentration. Per Triple Whale's 2025 benchmark data drawn from nearly 35,000 brands, advertisers committed 68.31% of total ad budgets to Meta alone, while Meta CPMs climbed 20% year-over-year to $14.19. An operator without channel-level attribution cannot detect when that concentration stops paying, because there is no per-channel revenue figure to set against the rising cost. So they just keep spending.
Cross-channel coordination is another dimension. Advertisers running coordinated campaigns across three or more platforms outperform single-platform strategies by a substantial margin, per 2025 cross-channel performance data. Capturing that lift requires attribution logic that works across all three channels, not just inside each platform's native dashboard. Without a unified view, the operator never sees the coordinated effect; they only see each platform claiming partial credit for something none of them fully caused.
Frequency data changes creative decisions, too. Per Criterion Global's 2025 research, 43% of people exposed to a restaurant ad visited the location, and viewers who saw the ad ten or more times were nearly twice as likely to visit. That is a pacing and creative rotation insight. It only surfaces when you have granular tracking in place.
Kill criteria become possible with real numbers. A channel consistently returning less than 2x ROAS over ninety days while customer acquisition cost exceeds several months of gross margin per guest is a candidate for reallocation. Platform-reported clicks cannot produce that calculation.
One might argue that most independent operators lack the time or analytical bandwidth to run these calculations. That is fair. But the alternative is not neutral: it is a budget set in December and never revisited, reallocated based on intuition, with no mechanism for correction. Channel-level attribution makes mid-cycle reallocation rational. Without it, reallocation is a guess with a spreadsheet attached.
The organic social trap illustrates the cost of measuring effort instead of revenue. A 2024 study cited in HubSpot's State of Marketing Report found that organic social consumed a substantial share of marketing effort while delivering the worst ROI of any channel measured. That finding is invisible when you are counting posts. It surfaces when you start counting attributed revenue.
Why local creator content is the channel where attribution discipline pays off most for restaurants
Local creators occupy a structurally unusual position in restaurant marketing. Their content drives real, geographically concentrated foot traffic. The default measurement setup treats that traffic as unattributable, because nobody built the infrastructure to capture it. So it disappears into the same bucket as everything else: vibes and impressions and a vague sense that something worked.
In a documented TikTok campaign case, a restaurant achieved a 9.2% lift in store visits. That number only became visible because someone constructed attribution infrastructure connecting a video view to a walk-in: tracking links, reservation pixels, POS-linked promo codes. Without that infrastructure, the same campaign would have reported views, saves, and shares. All meaningful signals of attention, none of them revenue. The campaign would have looked like awareness. It was actually acquisition. That distinction is worth real money, and most operators never make it.
The local creator advantage compounds with attribution because a creator whose audience physically lives within a restaurant's trade area drives foot traffic from people who can actually visit. That signal is geographically concentrated, which makes it easier to detect in POS data than the diffuse effect of a national campaign. Attribution makes the local effect legible. Without it, you are guessing that geography matters. With it, you can prove it.
Attribution also transforms creator selection from a judgment call into a data problem. Without it, operators choose creators based on follower count, aesthetic fit, or personal preference. With it, operators compare attributed visits per dollar across multiple creators and reallocate toward the ones producing measurable revenue. The difference between a creator who generates 500 views and no reservations and one who generates 200 views and twelve direct booking links is invisible without attribution. With it, the decision is obvious.
The broader ROI range for restaurant digital marketing sits between $3 and $5 returned per dollar spent at the strong end. Campaigns with granular attribution and geographically matched local creators have documented results well above that range. The measurement is not incidental to the performance; it is what makes the performance legible, repeatable, and worth doing again.
Profitable restaurant marketing at the operator level is a system: content matched to a local audience, distributed through paid channels with consistent attribution logic, measured against in-store revenue. Each component depends on the others. MMM names the problem elegantly, at an altitude most independent operators will never reach. Attribution infrastructure solves it at the level where their actual decisions live.