Restaurant Marketing ROI Benchmarks
Most restaurants measure ROI wrong, inflating numbers by ignoring what actually counts.

Start with the formula, because most operators aren't using it correctly. Marketing ROI is incremental revenue attributable to the campaign, minus total campaign cost, divided by total campaign cost. Three words do most of the damage when ignored: incremental, attributable, and total.
Incremental means revenue you wouldn't have gotten without the campaign. Operators routinely count total revenue during a promotional period instead, folding in every guest who would have walked through the door on a Tuesday regardless of whether they saw an ad. Attributable means you have some mechanism connecting the campaign to the actual visit or transaction. Total cost means creative production, labor, platform fees, and comped meals, not just the ad spend line on the invoice.
So where does the attribution gap actually live? Digital channels report clicks and conversions inside their own platforms. POS systems report revenue. Most restaurant tech stacks connect these two imperfectly, if at all, though platforms like Feastalytics, a restaurant analytics tool that unifies POS, delivery, and marketing data to tie campaigns directly to in-store sales, are built specifically to close it. That gap is where guesswork becomes indistinguishable from measurement. Meta's default attribution window counts a conversion if someone clicked your ad within seven days or merely viewed it within one day. Google uses data-driven attribution. TikTok runs a similar seven-day click, one-day view model. These are not the same windows, and comparing ROAS figures across platforms without standardizing methodology produces numbers that are technically accurate and fundamentally incomparable. I've watched operators present blended ROAS figures in budget reviews as though they were measuring the same thing, and nobody in the room questioned it.
One figure worth addressing directly: the often-cited average business-level ROI cited for U.S. restaurants is a whole-business figure measured across four quarters of operations. It is not a campaign benchmark. Citing it alongside channel-level ROAS figures is like comparing a restaurant's annual profit margin to the margin on a single entrée. Both are real numbers; they measure entirely different things.
The KPIs that actually sharpen the picture, customer acquisition cost, repeat visit rate, guest lifetime value, and channel-specific ROAS, each require POS integration to mean anything at the campaign level. Without it, you're approximating ROI and hoping the approximation holds.
The range operators should actually expect: blended ROI across channels
The widely cited range for strong digital marketing performance sits between $3 and $5 returned per $1 spent. For established restaurants running multiple channels simultaneously, a blended 4 to 6x revenue multiple is the benchmark for healthy performance. Both figures are defensible, and both are contingent on how you define the denominator.
Why does the blended number matter more than any single channel's figure? Because single-channel ROI calculations don't absorb the cost of awareness spend or channels with longer payback windows. An email campaign returning $36 to $42 per dollar looks exceptional, and it is, for that channel. But email is almost exclusively reaching guests already acquired through some other means. It is not paying for discovery. Strip away the acquisition spend that built the list and the email ROI figure becomes one piece of a longer calculation, not a standalone argument for efficiency.
What pulls operators below this range is usually one of two things: measuring ROI on ad spend only, then discovering the real number when full costs are finally included; or running campaigns with no mechanism connecting ad exposure to the actual visit. Both are fixable, and neither is fundamentally a marketing problem. They're measurement failures that happen to show up in the marketing budget.
Context matters. Roughly 39% of restaurant leaders identified marketing as a top investment priority in Restaurant365's 2024 State of the Industry Survey, yet the average independent operator allocates somewhere between 3% and 6% of gross revenue to marketing. The operators landing at the top of the ROI range are spending deliberately within or above that band, with systems in place to track what the spend is actually doing. Spending more without measurement infrastructure doesn't move the number up; it just makes the gap harder to see.
What email and SMS benchmarks reveal about channels that can actually be measured
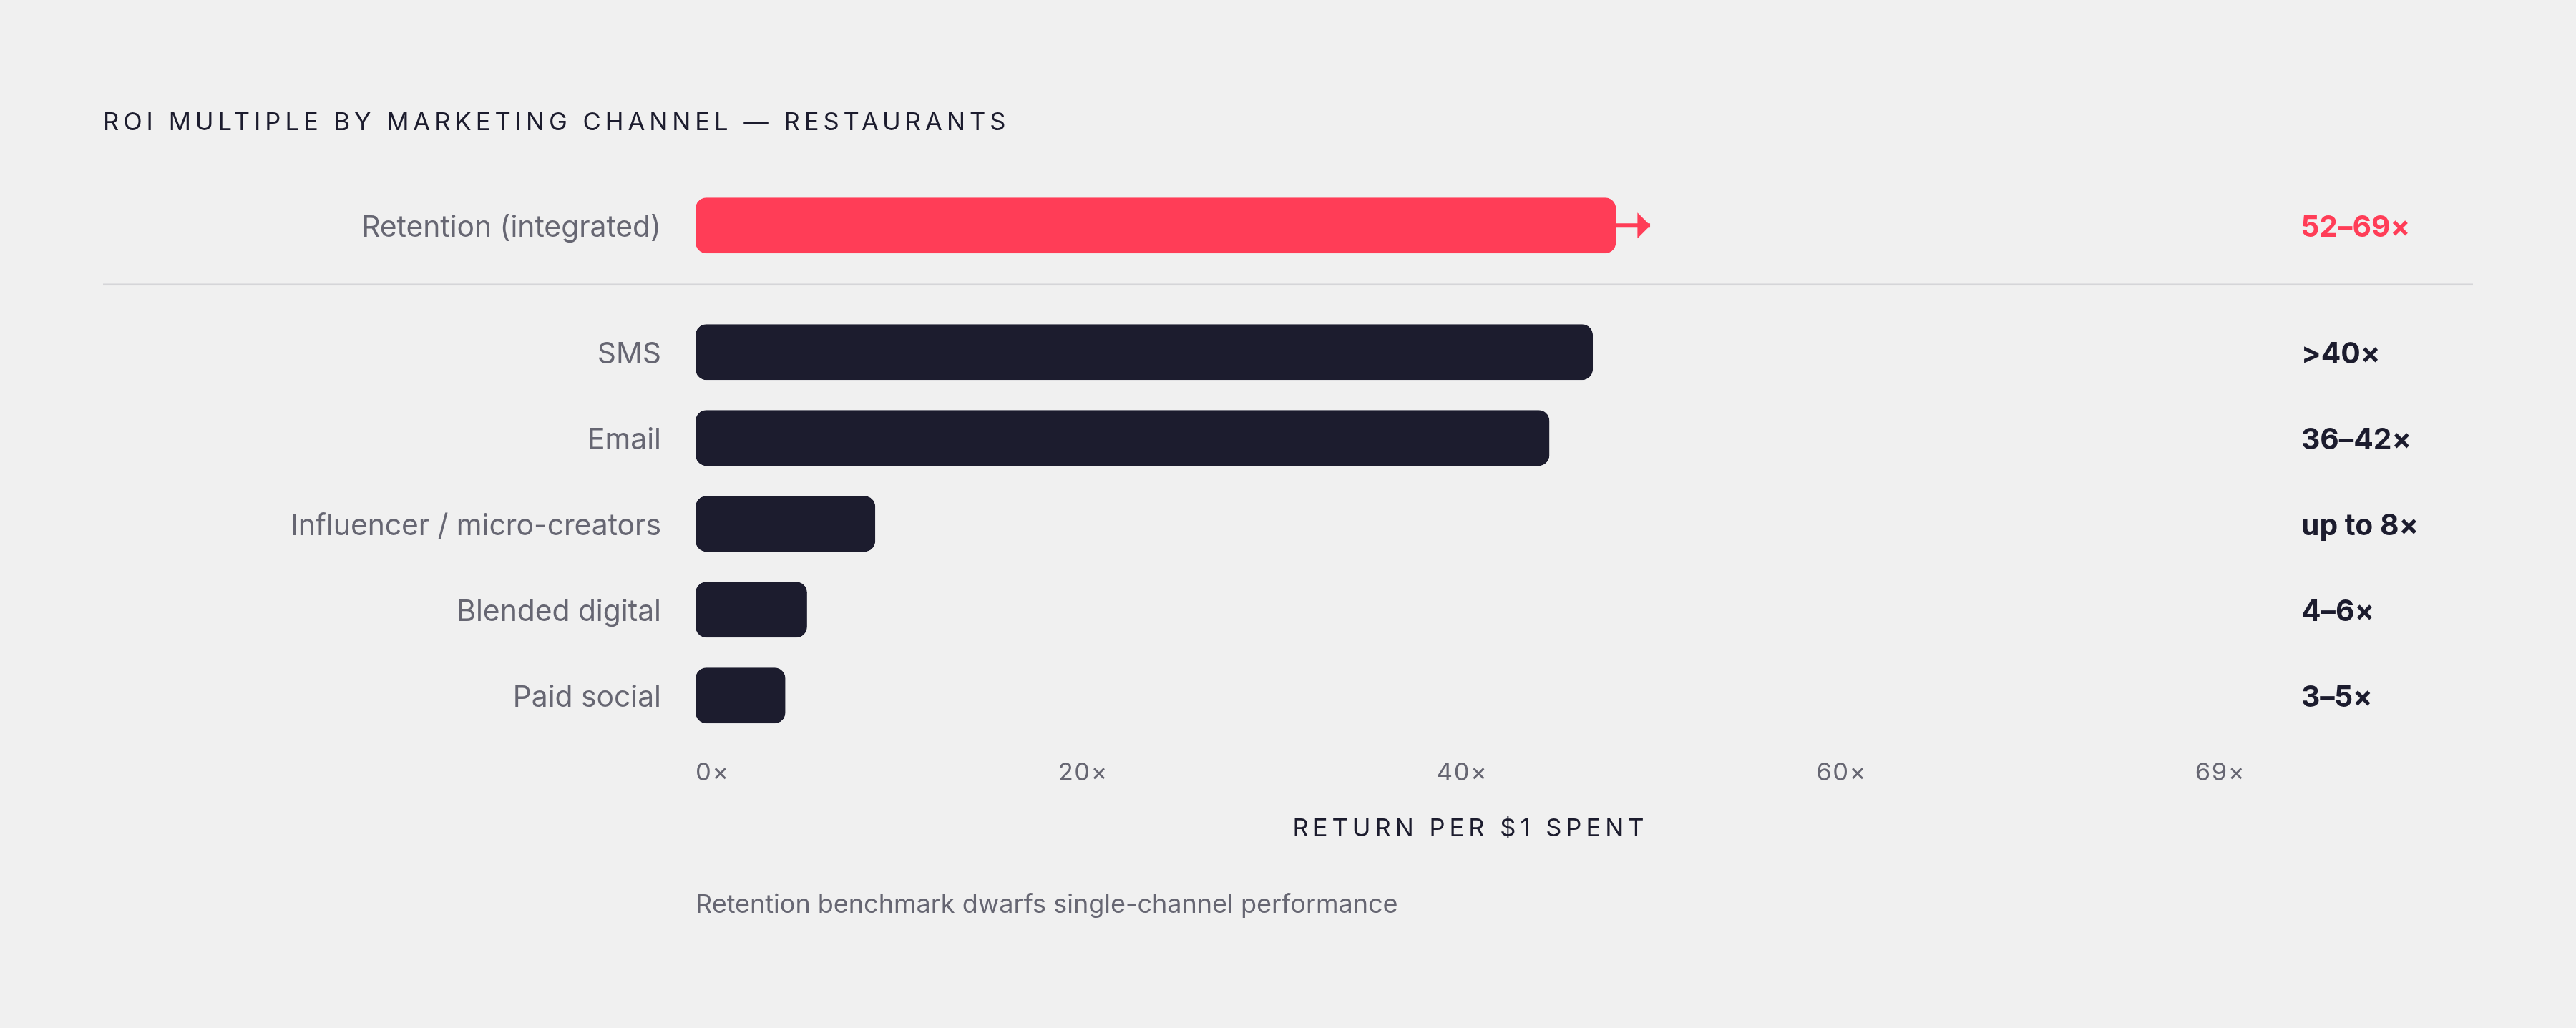
Email and SMS are the closest thing restaurant marketing has to a controlled experiment. A message goes to a known guest. The guest takes an action. That action is traceable to a revenue event at the POS. The attribution loop closes. This is why email and SMS benchmarks are the most credible figures in this entire discussion, and also why they're the most commonly misapplied.
Industry benchmarks for email in restaurant verticals sit at $36 to $42 return per $1 spent, with open rates around 25% and click rates around 3%. These figures typically count online orders or offer redemptions directly traceable to an email send. They do not count the walk-in guest who opened an email that morning and showed up for dinner without clicking anything. That guest represents real revenue, but disappears from the email ROI figure entirely.
It is also worth considering what's pulling that average upward. Automated behavioral workflows, triggered by specific guest actions like lapsing membership or a birthday, outperform generic broadcast campaigns by more than 7x. The $36 to $42 average is partially an artifact of operators who have personalization and automation working well. An operator blasting the same promotional message to their entire list every week is not getting $42 back per dollar. That average includes them; it's being propped up by the operators who've done the harder, less glamorous infrastructure work.
SMS conversion rates run above 15% in restaurant contexts, with ROI multiples frequently exceeding 40x. Same caveat: these reflect measurable digital actions, not untracked in-store visits. The honest ceiling on both channels is that they require an owned guest list built over time. A restaurant with no email capture, no loyalty data, and no SMS opt-ins cannot replicate these numbers immediately. The channel isn't the advantage. The accumulated first-party data is.
What email and SMS benchmarks ultimately reveal is that high ROI becomes achievable when the measurement loop closes. That's not an argument for email over other channels; it's an argument for traceability as a prerequisite for knowing whether anything is working at all.
Influencer marketing ROI for restaurants: what the numbers mean and where they break down
Influencer marketing has grown from roughly $1.7 billion in 2015 to a projected $32.55 billion industry by 2025. Food and drink content is the category consumers engage with most, with about 30% of respondents in Sprout Social data identifying it as their favorite type of influencer content. The scale is real. The ROI figures circulating alongside it are considerably messier.
The restaurant-specific figure most often cited is $6.50 returned per $1 spent, sourced to QSR Magazine's 2024 reporting. The cross-industry average from Influencer Marketing Hub sits at $5.20. A figure closer to 8x ROI, alongside a 30% lift in reservations within a week of posting, appears in 2024 to 2025 restaurant trend reporting for campaigns run with local food creators. That's a wide range, and the range itself should prompt a question: what exactly is being measured differently across each study?
Most influencer ROI studies measure platform-reported reach, engagement metrics, and promo code redemptions. Promo codes and unique URLs are the most reliable proxy available for in-store attribution. Without them, the ROI calculation typically runs engagement figures through an estimated revenue model, which is exactly as speculative as it sounds. The 8x figure likely reflects campaigns where reservations were directly trackable, a meaningfully cleaner measurement than estimating what percentage of a post's views translated into visits.
The discovery channel data is genuinely significant. Over half of millennials who visited a restaurant or ordered food online reported doing so after encountering it on TikTok, according to Nation's Restaurant News. Roughly 38% of all age groups reported the same. This establishes real consumer behavior. It does not establish tracked revenue attribution. Visit intent and attributed in-store revenue are separated by the same gap that makes attribution difficult everywhere else in this stack.
One figure that deserves more attention: Instagram's influencer fraud rate dropped from nearly half of accounts in 2023 to well over a third in 2024, per Influencer Marketing Hub. Still above one-third of the category. For operators basing ROI calculations on reach figures, that is a material distortion in the denominator. Ignoring it means the ROI math is wrong before the campaign even launches.
Why local micro-creators produce better per-dollar returns than larger accounts for most restaurants
A follower in Portland is worth nothing to a restaurant in Nashville. Worth stating plainly, because it gets ignored whenever operators evaluate creators by follower count alone.
The economics clarify quickly once you look at the engagement data. Local micro-influencers (accounts in the lower tens of thousands of followers) deliver engagement rates above 15% on restaurant content, compared to the low single digits typical of accounts with very large followings, per Influencer Marketing Hub's 2024 figures. Higher engagement on a geographically concentrated audience translates more directly to foot traffic than broad but passive reach from a larger account whose followers are distributed across dozens of markets.
The cost structure reinforces the ROI case. Nano and micro creators are often accessible for a comped meal rather than a four-figure sponsorship fee. When the denominator in the ROI formula stays small, even a modest number of attributable visits produces a strong return. About 73% of brands reported a preference for micro and mid-tier influencers in Later's 2025 Influencer Marketing Report, citing stronger engagement-to-cost ratios. The broader market has largely figured this out; many independent restaurant operators haven't.
Consumer trust compounds the advantage. About 69% of consumers report trusting influencer recommendations as much as those from friends or family. Local creators whose audiences already follow them for neighborhood-specific content carry that trust into a restaurant recommendation organically, without the visible transactional quality that degrades credibility on larger accounts. A 10,000-follower creator whose audience is concentrated in the restaurant's zip code is, operationally, more valuable than a 100,000-follower creator with national reach and no geographic density. Vetting for local audience geography matters more than the number at the top of the profile.
Retention marketing benchmarks and why they set the ceiling for lifetime ROI
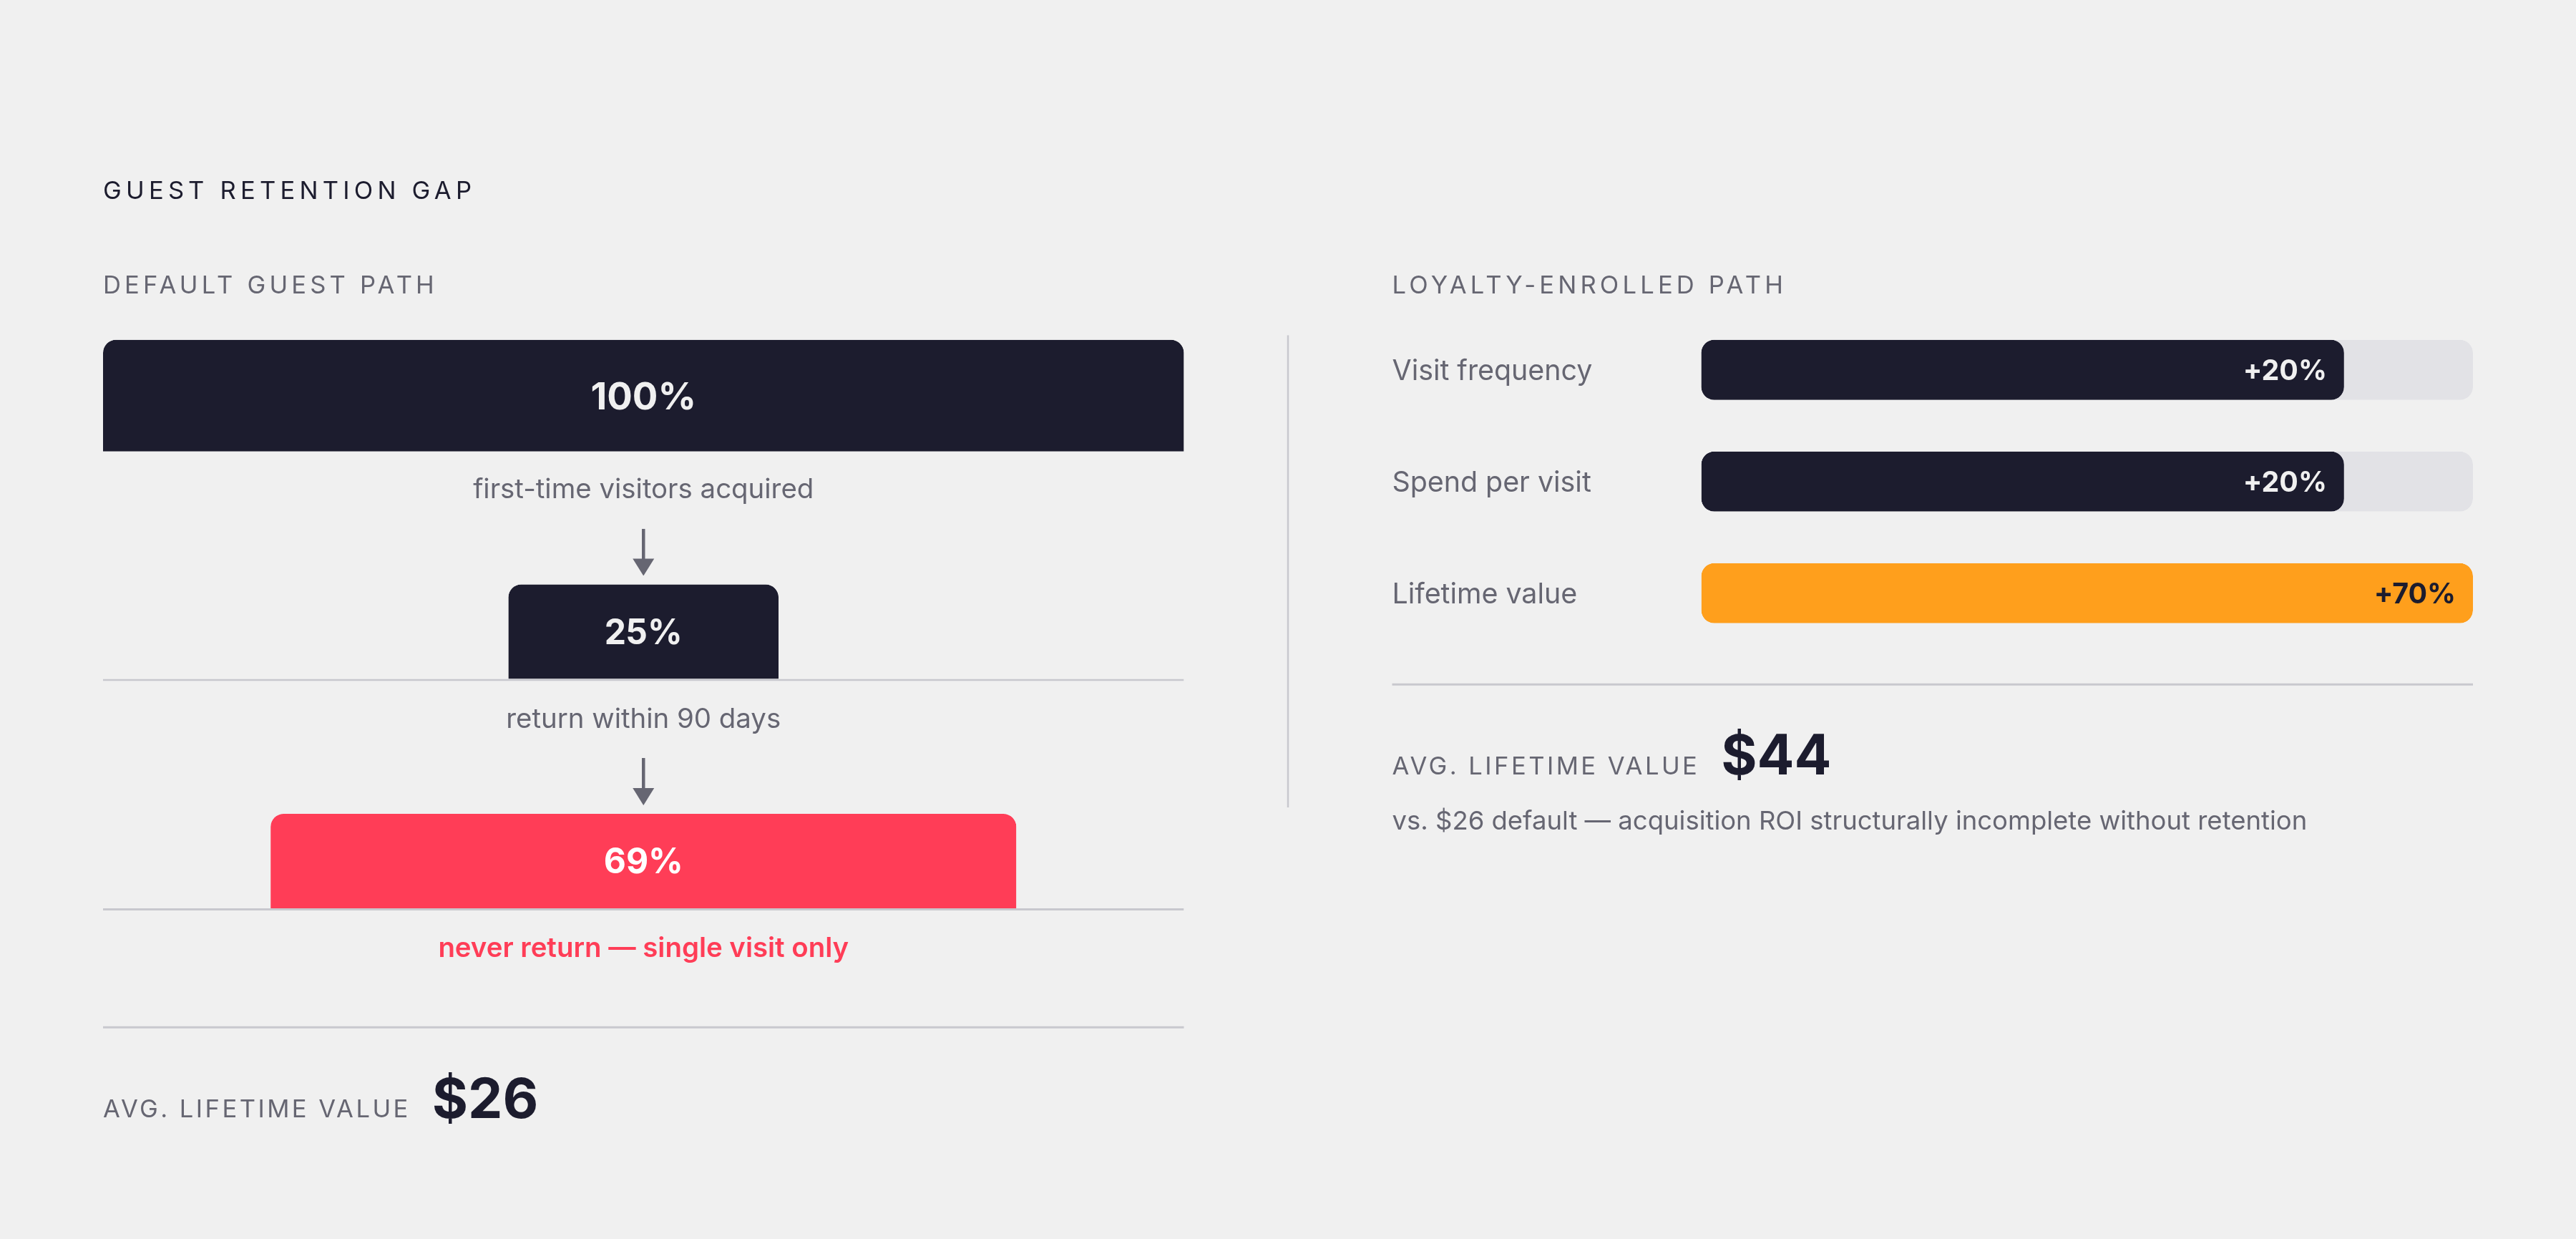
Here is the number that should reframe how every acquisition campaign gets evaluated: only 25% of first-time visitors return within 90 days. About 69% of guests never progress beyond a single visit, producing an average lifetime value of only $26, per Bloom Intelligence's 2025 figures. If an acquisition campaign's ROI is calculated on first-visit revenue, it's measuring a fraction of the potential value while the structural loss underneath goes unexamined.
That raises an uncomfortable question. Why spend heavily to acquire guests if the default outcome is that they don't come back? The acquisition ROI calculation is incomplete without accounting for what retention does to lifetime value. A campaign that looks profitable on first-visit revenue is break-even or worse once churn is factored in.
The revenue concentration reality sharpens this further. When roughly 60% of revenue flows from approximately 20% of guests, per Olo's 2024 research, the ROI math on retention is fundamentally different from the math on acquisition. Loyalty members visit about 20% more often and spend roughly 20% more per visit than non-members; customers enrolled in a loyalty program show 70% higher lifetime value, per Kard's 2025 data. These are not marginal differences. They describe a materially different business model operating underneath the same roof.
Restaurants with integrated customer data platforms and marketing automation are achieving 52 to 69x ROI on retention marketing, while those with fragmented systems are losing a substantial majority of guests to preventable churn, according to Bloom Intelligence's 2025 reporting. The 52 to 69x figure is retention-specific, methodology-dependent, and reflects the compounding effect of repeat visits over time. It is not comparable to a single paid social campaign's output. It is, however, a useful illustration of what closed-loop measurement and systematic retention work produce versus what fragmented, campaign-by-campaign spending produces over the same period.
Acquisition campaigns that don't feed into a retention mechanism (a loyalty program, email and SMS capture, a repeat-visit incentive) are generating one-time revenue. One-time revenue doesn't compound. It just ends.
How to tell whether a benchmark applies to your restaurant's actual situation
Before any benchmark is usable, it needs to answer four questions. What counts as "return": platform conversions, promo code redemptions, tracked in-store visits, or total revenue? What's included in "cost": ad spend only, or the full campaign cost including creative, labor, and comps? Is the measurement incremental, meaning does it isolate customers who came because of the campaign from those who would have come regardless? And what attribution window was used, and is it consistent across channels being compared?
A benchmark that can't answer those questions is a vanity metric dressed in performance clothing. Most published benchmarks are assembled exactly this way: aggregated across operators with different cost structures, different attribution setups, and different definitions of what "return" means, then smoothed into a figure that sounds actionable. It usually isn't.
But what if the goal isn't perfect measurement? Perfection isn't required. Promo codes and unique URLs close the attribution loop on creator campaigns without requiring expensive infrastructure. Offer redemption tracking inside Meta and Google provides a baseline for paid social attribution without third-party tools. Email and SMS with POS integration is often the fastest path to real revenue attribution, and it starts working the moment guest capture begins.
The goal is consistent measurement applied to the same channels over time, so an operator can see which spend is actually filling tables and make cuts with confidence rather than instinct. Every benchmark in this piece was built somewhere, by someone, using a specific methodology that suited their data. The number means something only when you know exactly how it was constructed. Ask that question before the benchmark shapes the budget.