Customer Lifetime Value as a Restaurant Marketing Metric
Track what guests are actually worth over time, not just what they cost to acquire.

There is a number most restaurant operators have never calculated, and it is probably the most important number in their business. Not food cost. Not labor percentage. Not average check. Those numbers tell you how well you ran last night's service. The number I am talking about tells you whether your business is compounding or grinding: what a guest is actually worth over the full span of their relationship with you.
Think of it this way: most restaurants are trying to fill a bathtub while the drain is wide open. The water looks fine from a distance. The tub is full. But the moment you stop running the tap, you realize you have not been building anything — you have been replacing everything, over and over, at full cost.
Customer Lifetime Value, sometimes called Guest Lifetime Value in hospitality contexts, is not a complicated concept. Total revenue a guest generates from first visit to last. The basic formula is Average Order Value multiplied by purchase frequency multiplied by customer lifespan. The inputs are sitting in your POS right now. A full-service restaurant with a $55 average check and a guest who visits four times a year is generating $220 annually from that relationship. Over three years, that guest is worth $660. Most operators have never written that number down, because their tools were built to process transactions, not to aggregate behavior across time. The dashboard shows covers and table turns; it does not show you the shape of a relationship.
That gap in perception is where an enormous amount of money quietly disappears.
When the Math Reveals What a Churn Rate Actually Costs You
The industry benchmark that should reframe everything: approximately 78.8% annual churn. That figure, cited in 2025 industry analysis, means nearly four out of five guests who walk through the door once rarely become regulars. They experienced the restaurant. They paid the check. They left, and they did not come back with enough frequency to matter.
The gap between a regular guest and a churned one is not sentimental. A 2025 industry analysis put regular guest lifetime value at $685 versus $555 for guests who churned before reaching regular status, a $130 difference per guest. Scale that by a realistic volume of first-time visitors at a single location, and the same analysis estimates approximately $375,380 in lost annual opportunity per location. Not from bad food. Not from a bad server. From guests who were never re-engaged after visit one.
Why does that number feel abstract? Because the loss is invisible. The restaurant is still busy. Transactions are still processing. The cover count looks fine. What the POS cannot show is how many of tonight's covers are brand-new guests replacing last month's brand-new guests who never came back — the business running at full speed on a treadmill.
Here is a question worth sitting with: what do you call a restaurant that keeps seating new guests but rarely sees them again? Busy. Just very, very busy.
The research on returning customer behavior makes this structural problem legible: repeat customers tend to spend substantially more than new ones, with some analyses placing the premium at roughly 67% more per visit. That is not a rounding error in the margin. That is the difference between a business that compounds and one that perpetually re-acquires its own customer base at full cost.
That raises a question: if churn is this expensive, and if returning guests are this much more valuable, why does so much restaurant marketing vocabulary center on acquisition? And more specifically: which acquisition actually works?
How CLV Changes What a Marketing Budget Decision Looks Like
The cost-per-click frame is intuitively appealing because it is legible. A click costs a measurable amount. You ran the ad; the ad produced clicks; the math closes. The problem is that this frame optimizes for the cheapest transaction, not the most valuable guest, and those two outcomes are frequently in opposition.
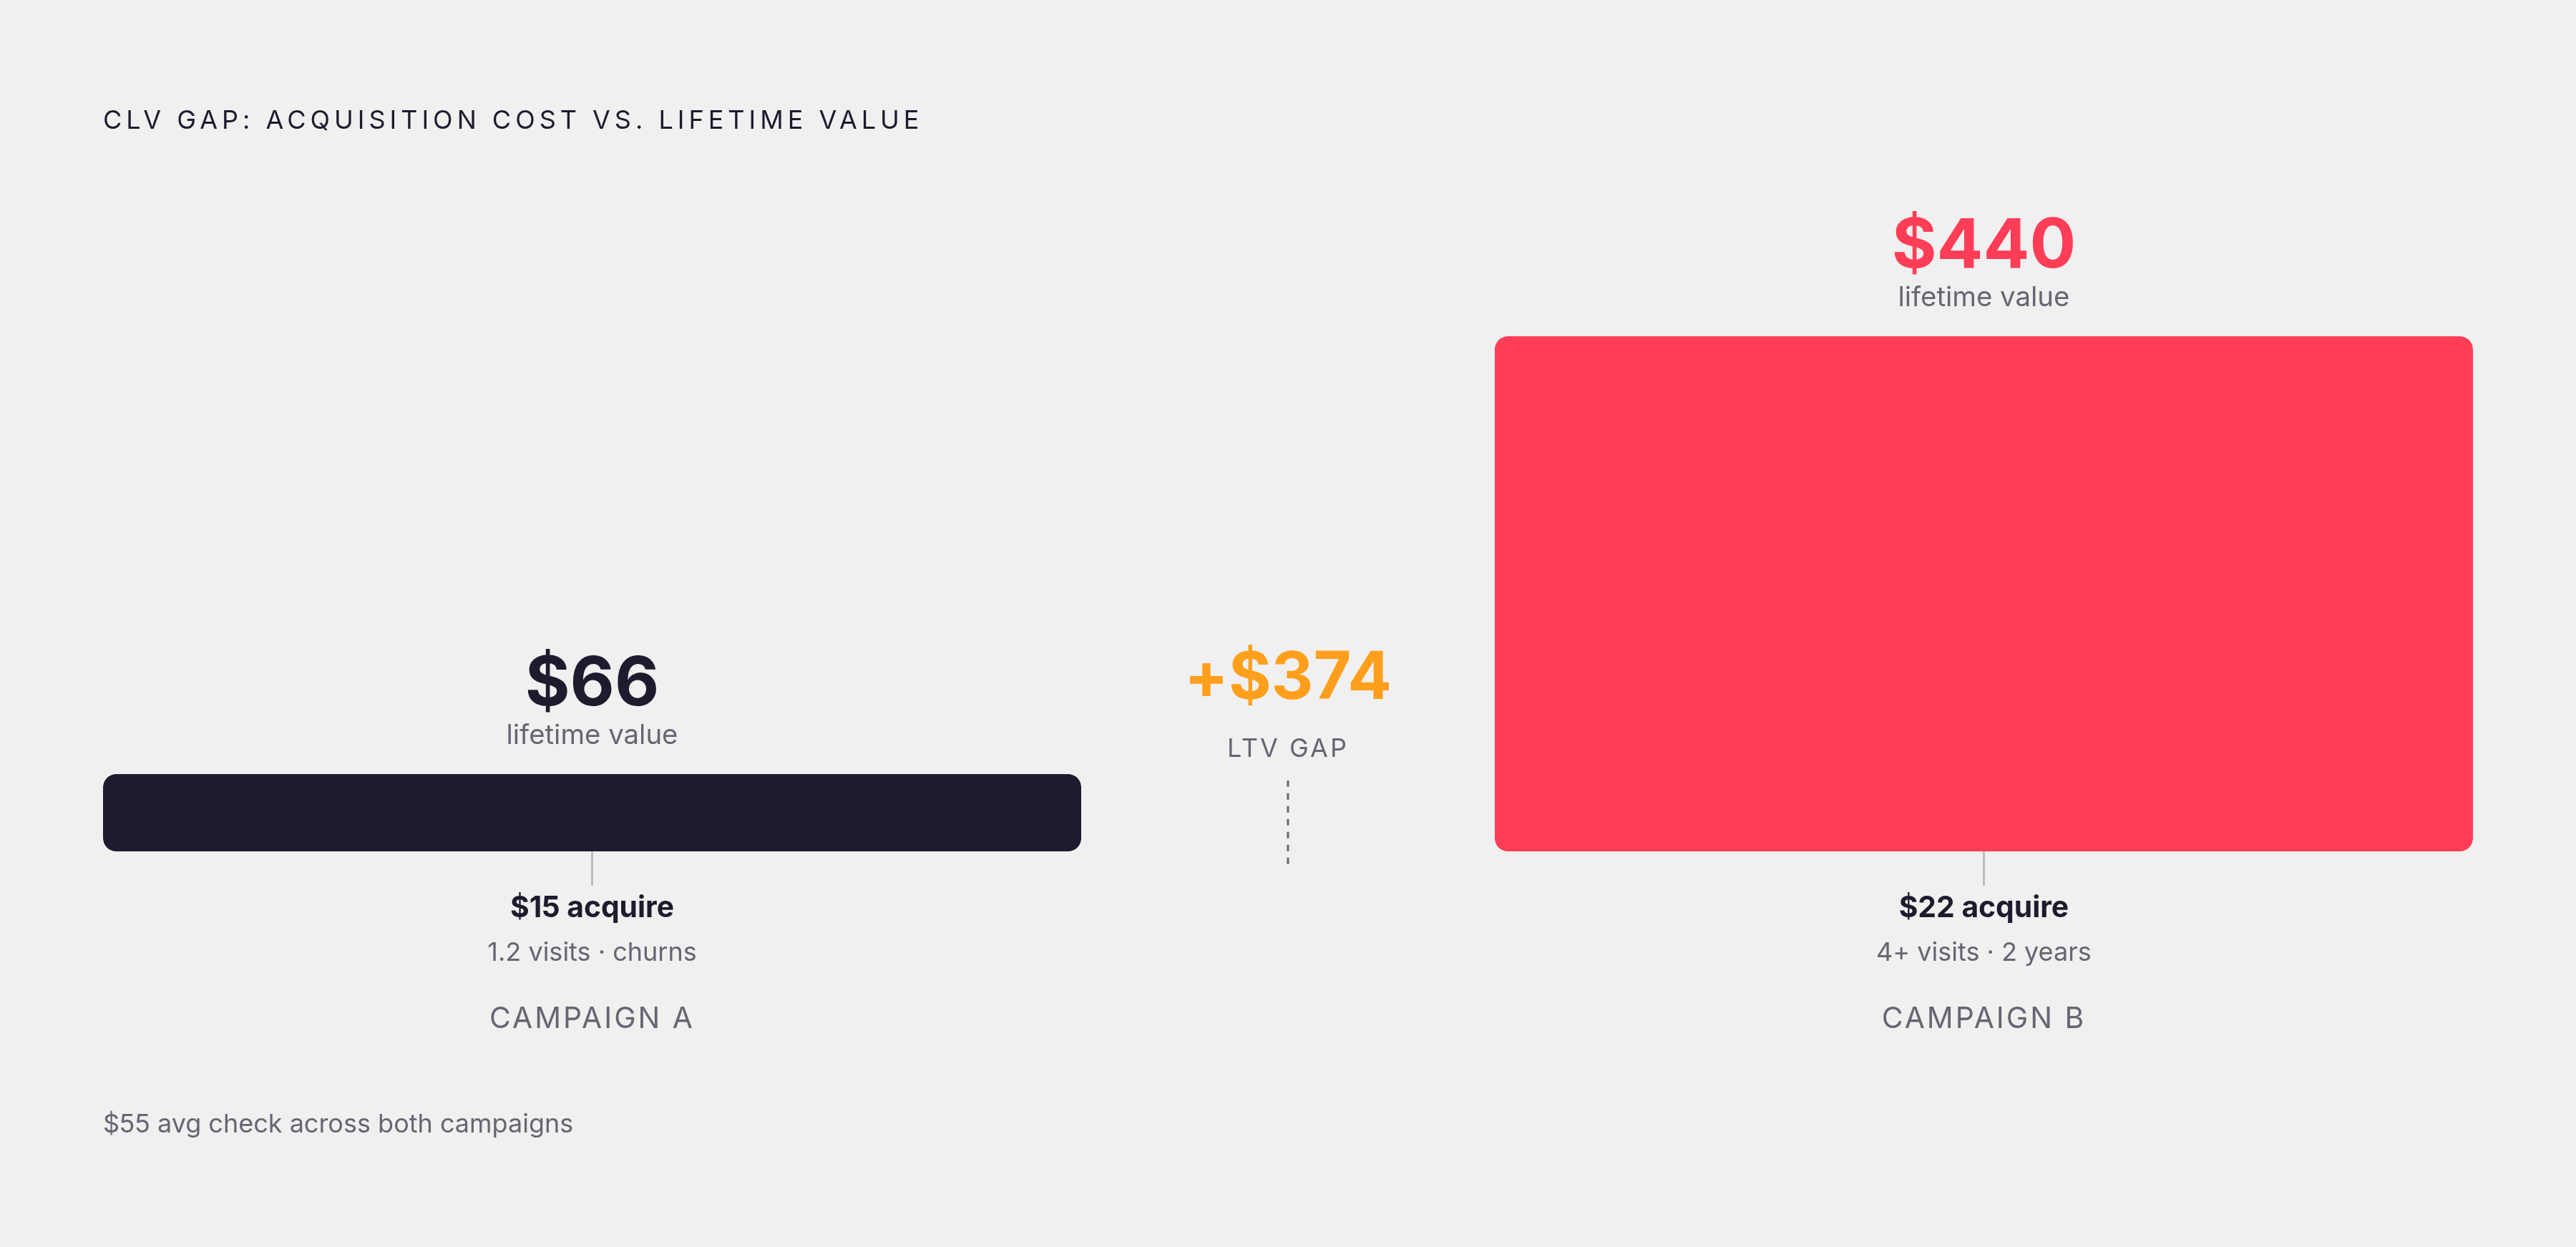
Consider two campaigns running simultaneously. Campaign A acquires guests at $15 per head; those guests average 1.2 visits before churning, producing a lifetime value of roughly $66 at a $55 check. Campaign B acquires guests at $22 per head; those guests visit four or more times per year for two years, producing a lifetime value approaching $440. Campaign A looks cheaper in every standard dashboard. Campaign B is dramatically more profitable, but only if you are tracking what happens to those guests after the first visit.
Cost Per Guest Acquired, for the restaurants that bother to measure it, runs roughly $8 to $25. The industry barely benchmarks this figure, and almost no one measures it against downstream lifetime value. So operators optimize Campaign A into oblivion while Campaign B gets cut for being "expensive." It is like judging a fishing rod by how light it is, not by how many fish it catches.
The argument that restaurants simply cannot afford the infrastructure to make this comparison collapses under the arithmetic: if a returning guest is worth $440 and a churned guest is worth $66, the operator who cannot distinguish between acquisition sources is not saving money on measurement, they are losing $374 per guest while congratulating themselves on efficient ad spend.
CLV also reframes what retention spending looks like. Once you know what a regular guest is actually worth, investing in keeping them is not a feel-good expense or a loyalty gimmick. It is arithmetic. The retention marketing ROI figures from 2025 practitioner data, in the range of 52 to 69 times return for restaurants using integrated customer data and marketing automation, only become visible when guest behavior is tracked across time rather than per campaign. Most restaurants never see that number because they are not looking at the right timeline.
The Connection Between the Ad and the Returning Guest Rarely Gets Made
Here is the structural problem, stated plainly. Ad platforms report clicks, impressions, and reach. POS systems report revenue. Nothing connects the two for in-person dining. E-commerce solved this a long time ago because money changes hands in one place, and that moment is trackable. A restaurant's "conversion" is a person walking through a physical door, and no pixel fires when that happens.
Toast and Square have APIs. Meta has the Conversions API. Google has Offline Conversion tracking. The technical components exist. What does not exist, for most independent operators, is someone to connect them. So operators default to what the platforms provide: dashboards full of metrics that the platform controls and has every incentive to make look favorable. Reach is up. Impressions are strong. The restaurant was busy on Saturday, and the promotion was running on Friday, so the promotion must have worked. Correlation, dressed up as causation, dressed up as a marketing report.
The 2025 Nielsen Annual Marketing Report found that only 32% of marketers globally measure media spending holistically across digital and traditional channels, down from 38% the prior year. The direction of that trend is worth sitting with. Measurement is getting worse as the number of channels grows. The practical consequence for restaurants: channels get cut because the measurement is broken, not because the channel stopped working. Real revenue disappears while the data is misread as confirmation.
It is also worth considering what operators do not lose when attribution fails: a sense of confidence. The dashboard tends to have something positive to report. That is hardly an accident.
Attribution Methods That Can Actually Close the Gap
The spectrum runs from simple and limited to rigorous and expensive. Starting at the accessible end: promotional codes and unique reservation links cost nothing to implement and produce clean, direct data. Every redemption is a tracked conversion. If a guest books through a campaign-specific link on OpenTable or Resy, the attribution is direct. These methods are limited to promotional contexts and booking-dependent formats, but they are more than most operators are doing today.
Meta and Google both offer platform-native store visit tracking, using mobile location data to estimate how many people who saw an ad subsequently visited the location. These figures are directional rather than precise, but they provide a baseline that is more defensible than impressions alone. Third-party store visit attribution goes further, matching ad-exposed users to device location history and comparing visit rates against unexposed control groups to calculate incremental lift.
The most rigorous method is incrementality testing: splitting an audience into exposed and unexposed groups and measuring the actual revenue difference. A national QSR chain using mobile in-app ads with a discount offer measured a 23% lift in in-store visits among exposed users versus the control group, using this methodology. Papa Murphy's recorded a 2.11% conversion rate and a $0.68 cost-per-store-visit through a similar approach. These are not hypothetical outcomes; they are what happens when the measurement infrastructure exists to see them.
But there is an honest ceiling here, and it matters. Most attribution methods can tell you that a visit happened. They cannot reliably tell you whether that visitor came back three weeks later. Connecting the first visit to the second, third, and fourth requires POS integration, and most attribution approaches stop before that handoff. That ceiling is precisely where lifetime value stops being calculable from attribution data alone. The visit is measurable; the relationship is not, unless the systems are connected end to end.
Multi-touch attribution adds another layer of complexity: a guest encountered a TikTok post, then an Instagram story, then clicked a promotional email before making a reservation. Single-touch models credit one moment and ignore everything that preceded it, which distorts budget allocation in ways that compound over time. The channel that "gets credit" is often not the channel that drove the decision.
What Local Creator Content Does to the Attribution Problem That Generic Ads Do Not
Most restaurant social campaigns have a geographic problem that rarely gets named. The algorithm serves the ad to whoever it predicts will engage, which frequently includes people who will never be within a reasonable distance of the restaurant. Impressions accumulate. The cost-per-click looks acceptable. None of those impressions will convert because the audience is geographically irrelevant.
Local creators invert this. Their audiences are concentrated near where they live, because local content attracts local followers. The people who see a post from a creator in the neighborhood are, structurally, the people who can act on it. That geographic concentration does something important to the signal-to-noise ratio: when you measure which views drove visits, the conversion pool is smaller and more defined, which makes attribution more tractable without requiring sophisticated infrastructure.
Consumer behavior research supports why this matters at the discovery stage: 72% of people use social media to research restaurants, and 45% report having tried a new restaurant after seeing a social post. Local creator content hits that discovery behavior in an audience that has both the motivation and the proximity to follow through. That is a meaningfully different situation than a broad-reach campaign reaching someone three states away who double-taps and moves on.
There is a compounding effect worth noting. Local creator content lives on the creator's profile after the campaign ends. It continues to surface in discovery, in shares, in search, without additional spend. A paid campaign runs until the budget is exhausted; a well-placed creator post can drive visits months later. The effective reach extends well beyond the campaign window.
What does this mean for lifetime value specifically? A campaign that acquires guests who live nearby has a structurally higher probability of producing repeat visitors than a broad-reach campaign acquiring random first-timers. Proximity is a reasonable proxy for relationship potential. The guest who lives twelve minutes away and was already looking for a place like this is a different acquisition than the out-of-town visitor who happened to see an ad.
How to Read CLV by Acquisition Source Once Attribution Is Working
The question that attribution makes answerable is not simply "did this campaign drive visits?" That is the wrong question, or at least an incomplete one. The right question is: "Did the guests this campaign acquired become regulars?"
Segmenting lifetime value by acquisition source reveals things that aggregate data cannot. Which channels tend to acquire high-frequency guests versus one-time visitors. Which creative formats attract guests who spend more per visit. Which audience segments produce the longest customer lifespans. These distinctions are invisible if you are looking at cost-per-click; they are legible if you are tracking post-acquisition behavior.
The decision implications are significant. Once Campaign A demonstrably acquires guests with a $440 lifetime value and Campaign B acquires guests worth $66, budget allocation is no longer instinct. It is arithmetic. The more interesting implication involves the timeline for evaluating brand-building spend. Brand campaigns frequently require six to twelve months before their impact on guest behavior becomes measurable. The cost-per-click frame can kill them after two weeks because nothing clicks immediately. The CLV frame provides a more appropriate timeline to evaluate them, one measured in relationships rather than transactions.
Expansion decisions look different through this lens too. For a restaurant group evaluating a new market, the relevant question is not just foot traffic or demographic income levels. It is whether this market produces behavioral patterns that convert first-time visits into recurring relationships. Lifetime value data across existing locations can inform that question in ways that traditional site selection criteria cannot.
Building Toward CLV Measurement Without a Data Engineering Team
The honest barrier: most of what this article describes requires data connections that independent restaurants have not built, and the prospect of building them is legitimately daunting. But starting does not require solving everything at once. It requires replacing one question with a better one.
Step one is calculating a baseline CLV from data already in the POS. Total revenue divided by total unique guests gives a rough per-guest average. If the system tracks repeat visits, Average Order Value multiplied by visits per guest per year multiplied by years active gives a more refined figure. Even an approximation changes how you think about what an acquired guest is worth. The number does not need to be exact to be directionally useful.
Step two is adding one attribution layer to the next campaign. A promo code. A campaign-specific reservation link. These cost nothing to implement and produce immediate, clean data. This is not a complete attribution system; it is a single data point that begins to connect a marketing action to a guest behavior. More than most operators are tracking today.
Step three is tracking whether guests acquired through specific campaigns return. This requires a POS or CRM that logs guest identity across visits. Loyalty programs are the most accessible entry point; they are imperfect, but they create the linkage between visit one and visit two, and platforms like Feastalytics, a restaurant analytics tool that unifies POS, delivery, and loyalty data to tie specific campaigns back to in-store revenue, are built to make that linkage visible across the full acquisition-to-repeat-visit arc. Even 60 to 90 days of re-visit data begins to differentiate high-value acquisition sources from low-value ones. The bar for meaningful insight here is low, because almost no one has set it.
Knowing approximate Cost Per Guest Acquired alongside even a rough lifetime value estimate puts an operator measurably ahead of most peers. That is not a comfortable observation about the industry, but it is an accurate one.
The goal is not a perfect attribution system. The goal is replacing "how many clicks did we get?" with "what is this guest worth?" as the frame for every marketing decision. One question treats the ad budget as a recurring cost. The other treats it as an investment with a calculable return. Those two frames produce different decisions, different channel mixes, different creative briefs, and, over time, meaningfully different businesses. The shift in question precedes everything else.