Multi-Touch Attribution Applied to Restaurant Marketing Funnels
How restaurants can measure which marketing actually fills seats, not just clicks.
There is something quietly absurd about a restaurant operator spending real money on Instagram ads, watching the impressions climb, and then standing at the host stand on a Friday night unsure whether any of those impressions are the reason the room is full. The impressions look good. The clicks look decent. The dining room looks full. Whether these facts are related is, structurally, unknowable without deliberate effort.
That gap is not a failure of imagination. It is a property of brick-and-mortar. Roughly 90% of retail transactions still occur in physical locations, according to U.S. Census Bureau data from 2025, which means the measurement problem restaurants face is not an outlier condition. It is the default condition of any business where the conversion event is a human being walking through a door. The funnel ends at a table, not a checkout cart, and most attribution infrastructure was built for checkout carts.
Multi-touch attribution (MTA) is the framework that attempts to close this gap. Not perfectly. Not cheaply at scale. But meaningfully, if it is set up with clear eyes about what it can and cannot do. What follows is an attempt to explain how, practically, inside a context where the final conversion happens in a dining room.
What Multi-Touch Attribution Actually Is, and What It Actually Isn't
Attribution is the act of assigning credit for a conversion to the marketing activity that influenced it. The question is how much credit, and to which activity, when multiple touchpoints precede a single conversion.
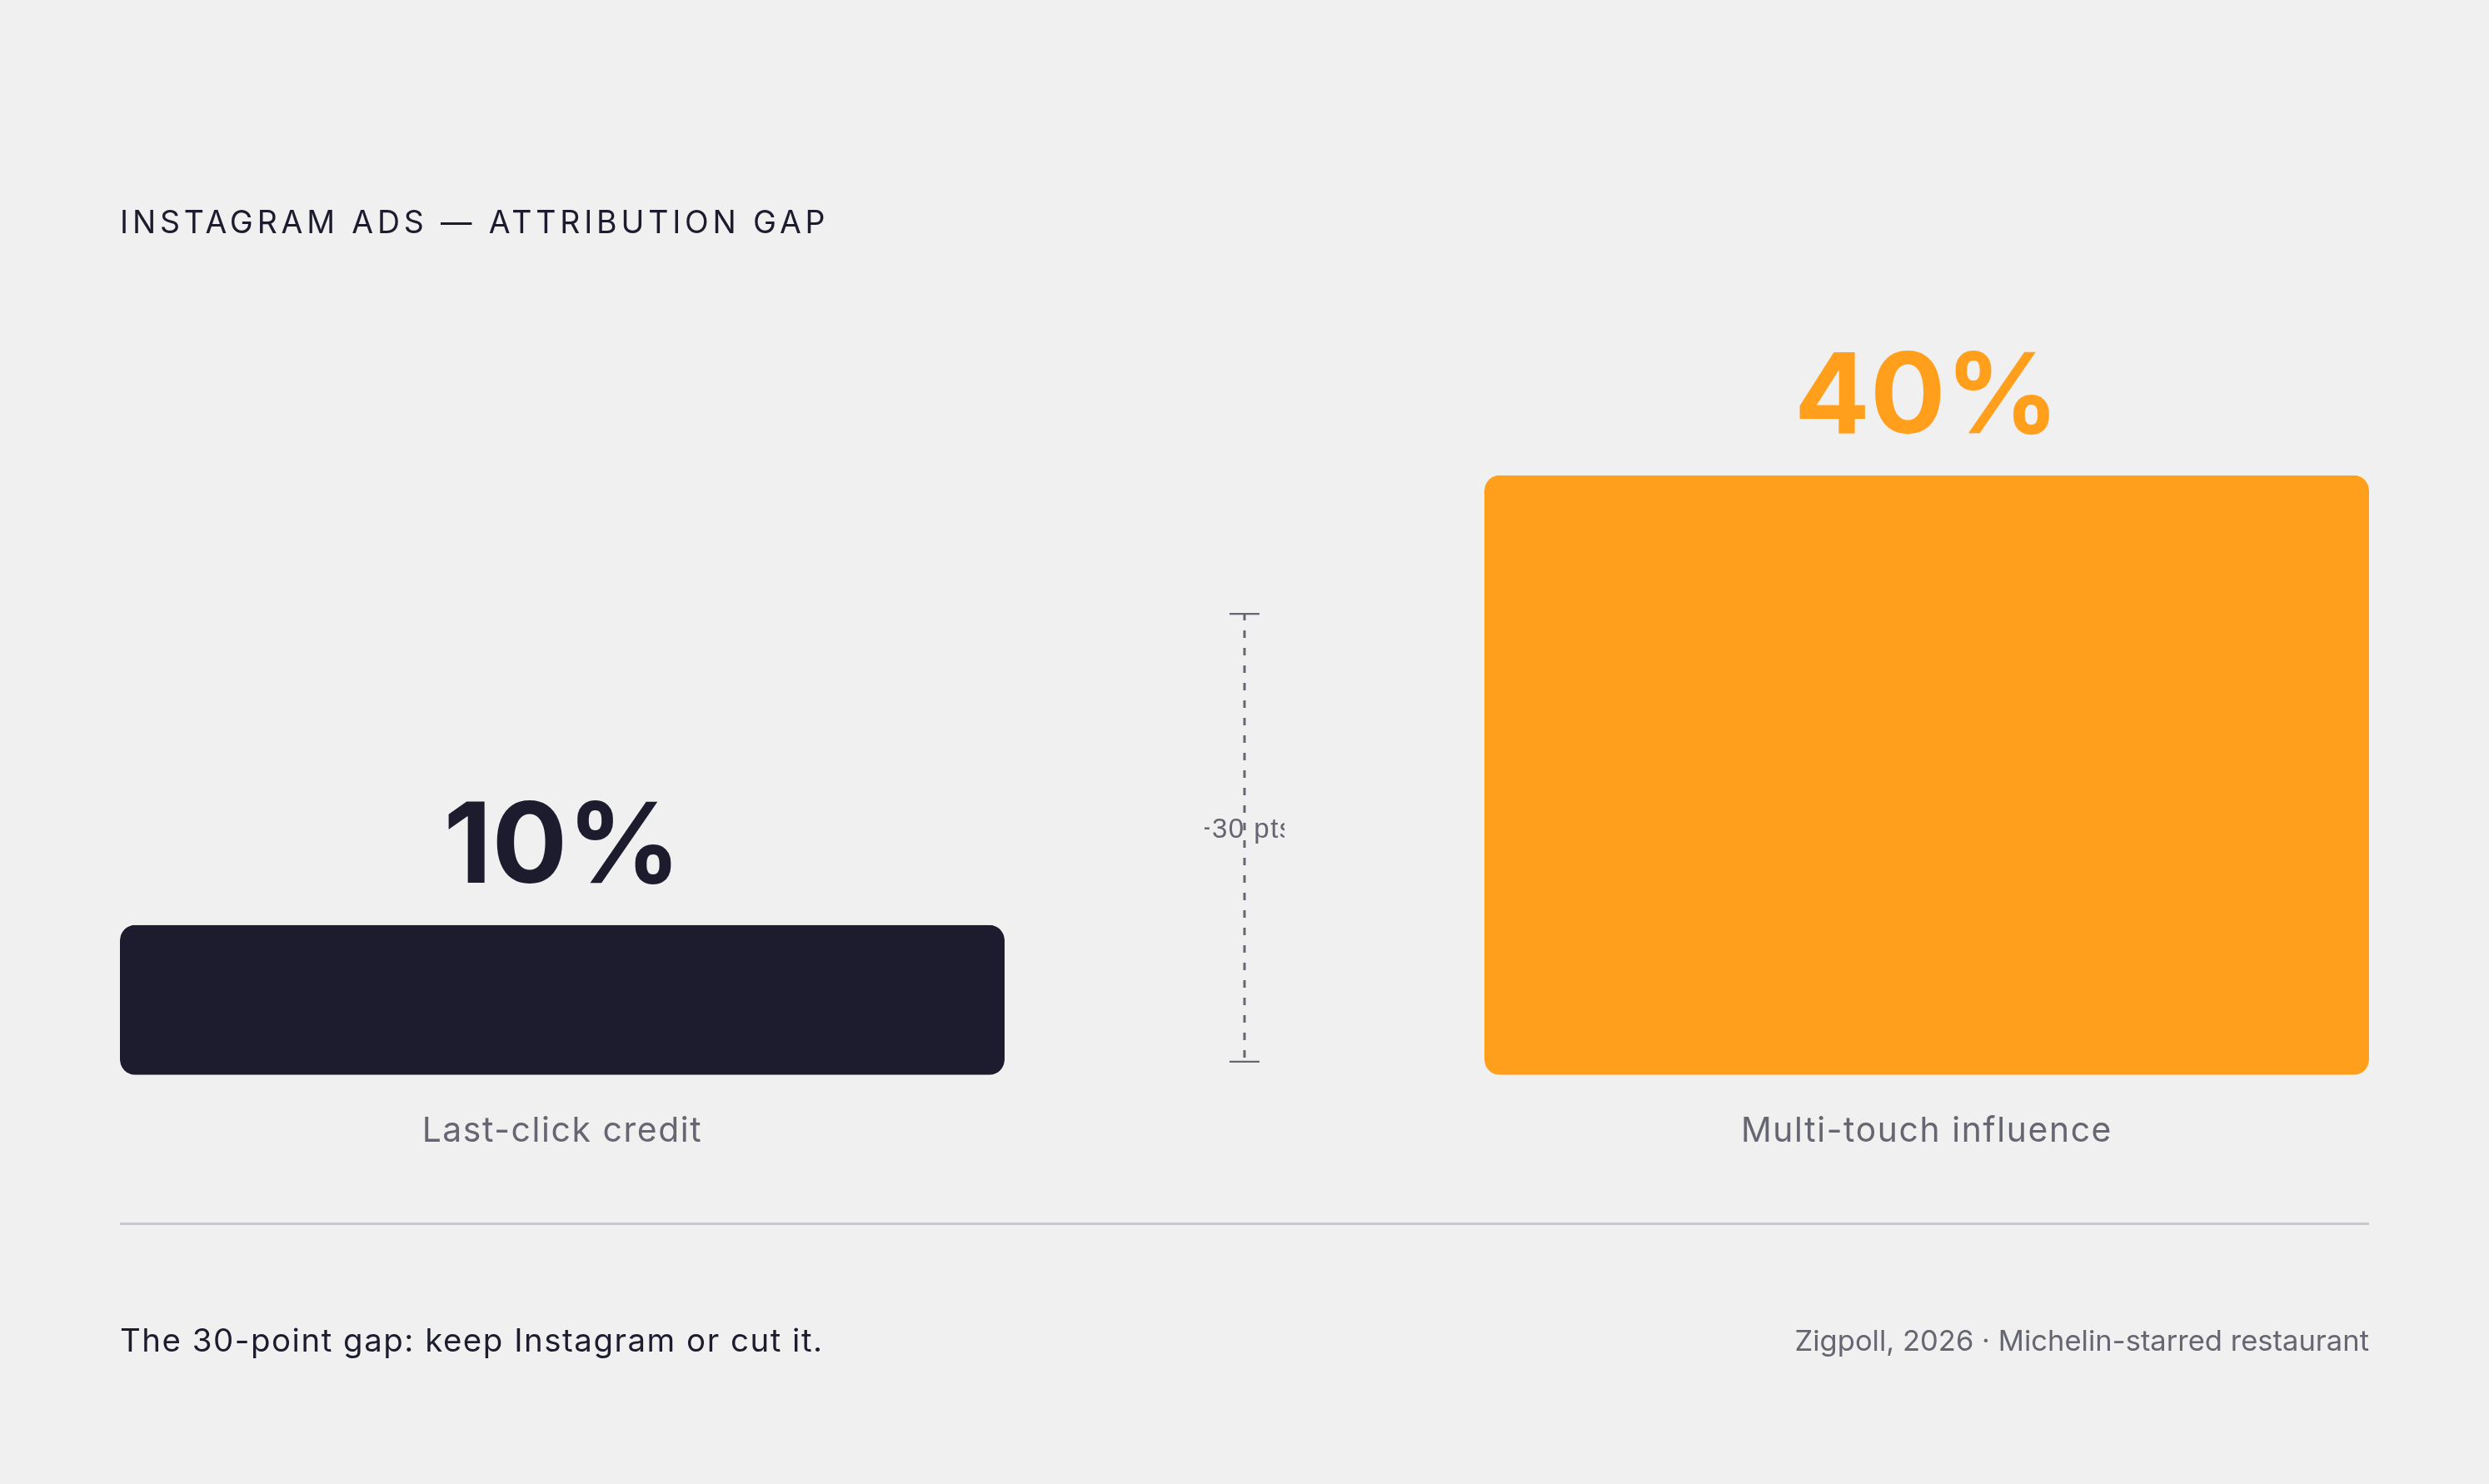
Single-touch attribution answers this simply: give all the credit to one interaction. The most common version in restaurant marketing is last-click, which is what Meta, Google, and most reservation platforms report by default. A guest sees a TikTok, searches Google a week later, clicks a retargeting ad, and books on OpenTable. Last-click attribution gives the retargeting ad 100% of the credit. The TikTok gets nothing. To understand why this matters, consider that one Michelin-starred restaurant found its Instagram ads directly drove only 10% of reservations, but influenced 40% of all bookings when multi-touch paths were examined, per Zigpoll data from 2026. That is not a rounding error. That 30-point gap is the difference between an operator keeping Instagram in their media plan or cutting it entirely.
Multi-touch attribution assigns credit across the full sequence of touchpoints in a customer's journey rather than awarding everything to the last one. How that credit is distributed depends on the model chosen.
What MTA is not: it is not a single tool, a dashboard feature, or something that turns on automatically. It is a measurement framework. Building it requires deliberate setup across channels, and the outputs it generates are directional signals, not financial verdicts. Nearly 35% of U.S. marketers planned to invest in MTA over the following year, per a 2025 EMARKETER survey, which means the majority had not yet done so. Restaurants, characteristically, are likely trailing even that curve.
The Four Models, and Which Restaurant Problems Each One Actually Solves
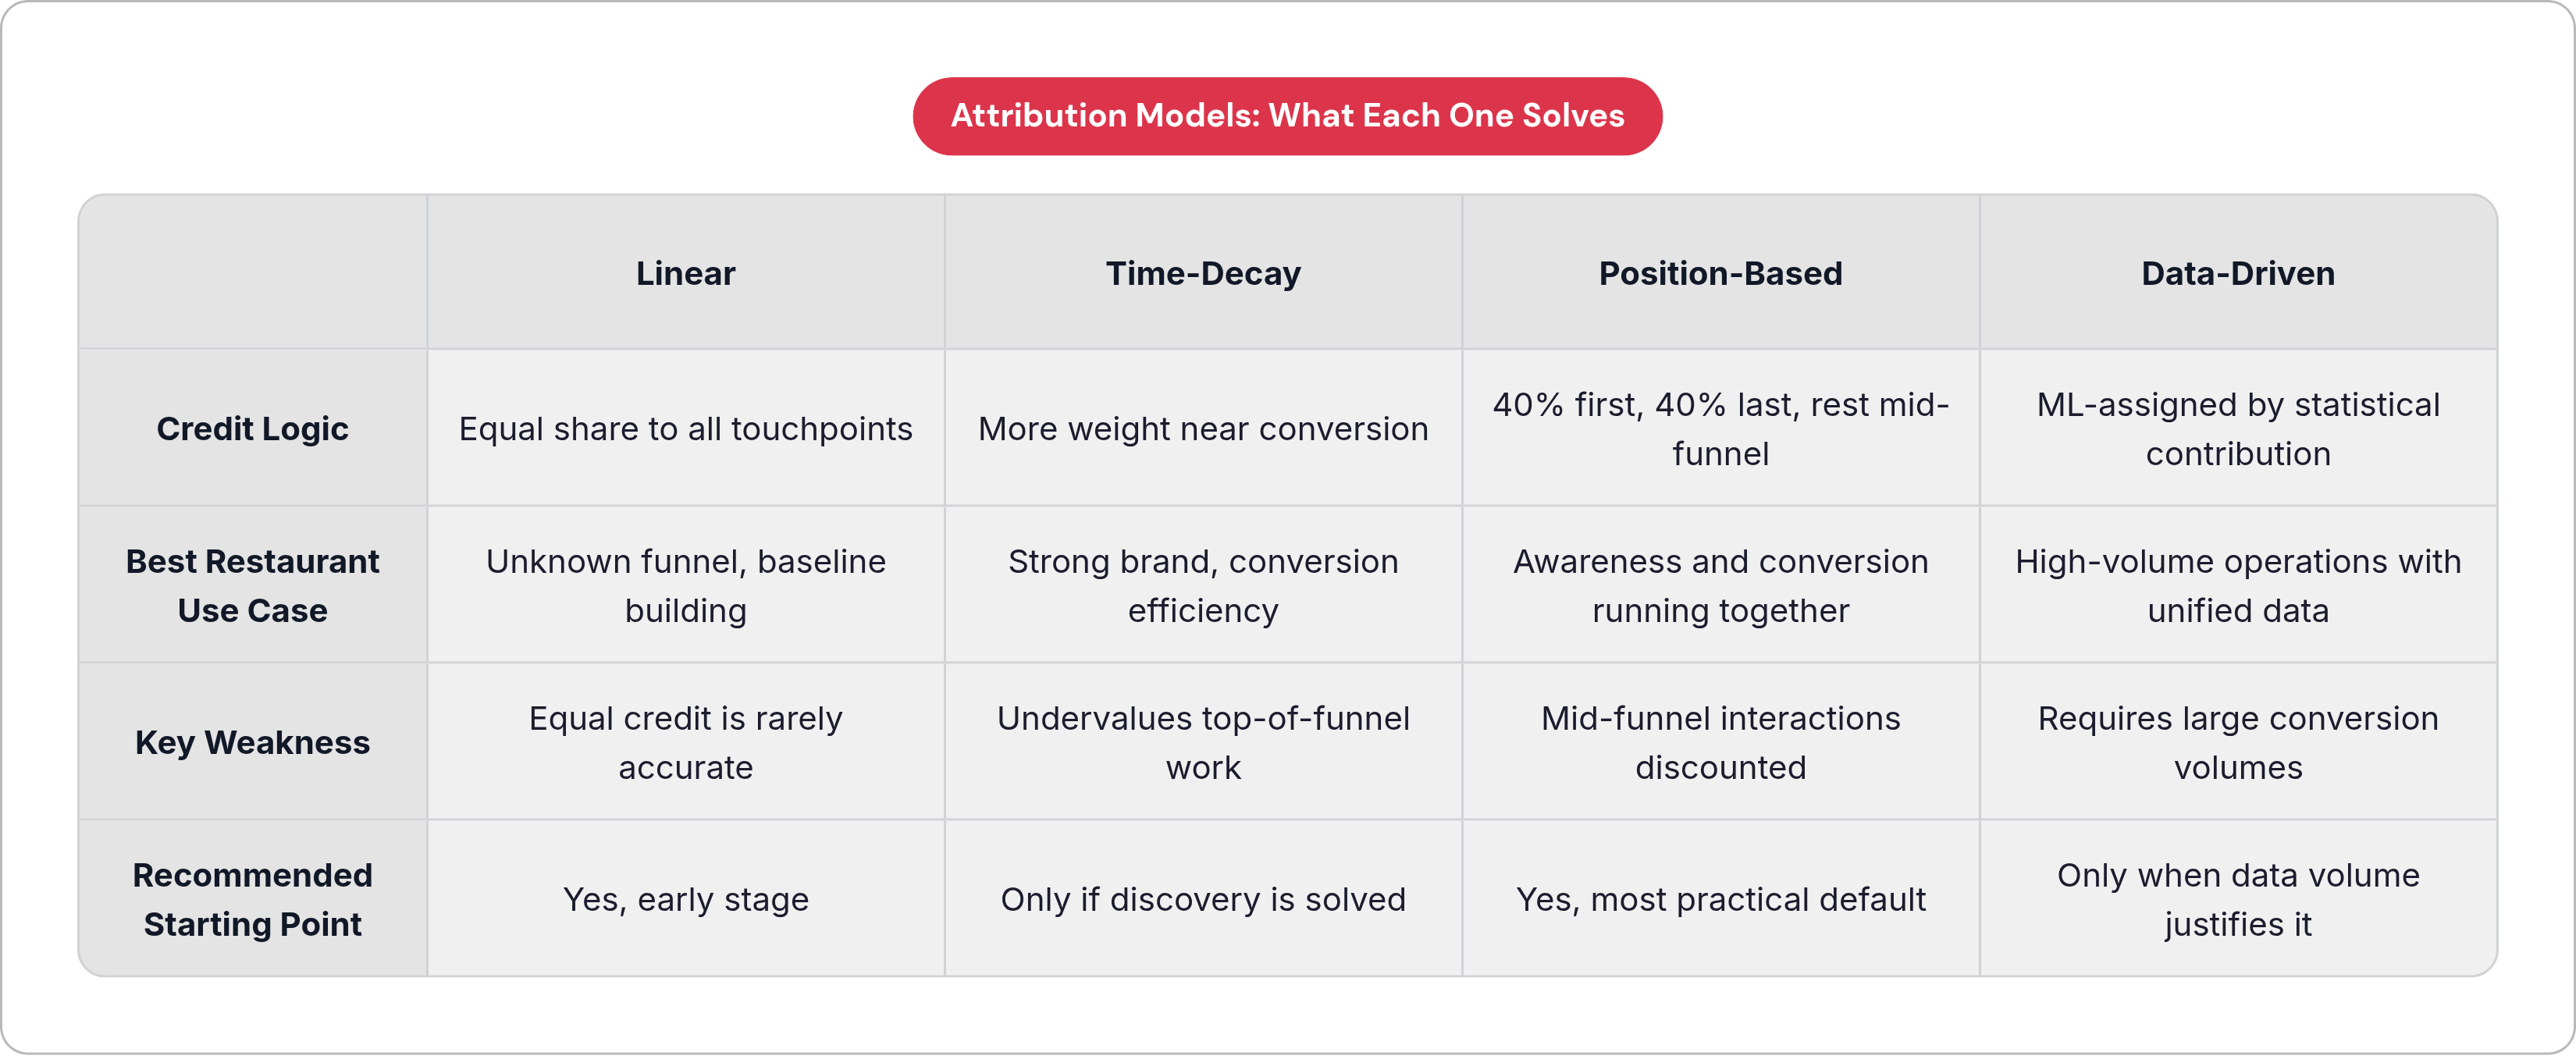
Linear attribution distributes credit equally across every touchpoint in a converting path. If a guest touched five channels before booking, each receives 20%. This model's virtue is its honesty about uncertainty: it is appropriate when an operator does not know which stage of the funnel drives conversion and wants a balanced baseline before optimizing. Its weakness is that equal credit is almost certainly wrong in practice, even if it is wrong in a less consequential direction than last-click.
Time-decay attribution weights touchpoints more heavily as they approach the conversion moment. The closer to booking, the more credit assigned. This model suits operators who already have strong brand awareness and are solving a conversion efficiency problem rather than a discovery problem. It will consistently undervalue top-of-funnel work.
Position-based attribution, sometimes called the U-shaped model, allocates roughly 40% of credit to the first touchpoint, 40% to the last, and distributes the remainder across mid-funnel interactions, per BlueConic data from 2026. The logic is intuitive: discovery matters, and the final decision moment matters; everything in between is connective tissue. For restaurants running awareness and conversion campaigns simultaneously, this is often the most practically defensible starting point.
Data-driven or algorithmic attribution uses machine learning to assign credit based on each touchpoint's actual statistical contribution to conversion. It is the most accurate model available. It is also the most demanding. It requires meaningfully large conversion volumes and a unified attribution solution to produce reliable outputs. Most independent restaurants will not have that data volume for months, possibly longer.
That raises an important question for operators deciding where to begin: what is the actual objective? If the goal is demand creation, reaching diners who have never encountered the restaurant, earlier touchpoints deserve more credit and position-based or linear models capture that. If the goal is demand capture, converting people already actively searching, weighting toward final-decision steps with time-decay makes more sense. Most single-location operators should start with position-based or linear and build toward data-driven only when the data volume justifies it.
How the Restaurant Customer Journey Actually Unfolds
The textbook funnel is linear. The actual diner journey is not.
At the top, discovery happens increasingly on social platforms. Forty-one percent of Gen Z diners use TikTok to search for and discover new restaurants, per MenuTiger data from 2025, and roughly 72% of diners use social media to research restaurants before visiting. Diners, particularly younger ones, are now reaching for social platforms before Google and before Yelp. A local creator's Reel, a friend's tagged Story, a sponsored video that stops the scroll: these are real awareness events, even when they generate no measurable click.
Mid-funnel, the guest transitions to search. The brand name surfaces in Google. Category searches appear: "wood-fired pizza near me," "birthday dinner downtown." This is where intent becomes legible. Worth noting, as of July 2025, Instagram content is indexed by Google, meaning a well-captioned Reel with location keywords can surface organically in search results. The top and mid-funnel are no longer cleanly separate.
Lower in the funnel, the decision crystallizes: a reservation platform click, a promo code applied, a direct call. These moments are trackable. They are also the only moments most operators actually measure, which is exactly the problem.
Post-visit, the funnel continues, though many operators treat the first visit as the finish line. Loyalty members visit more frequently and spend more per visit than non-members, per Kard data from 2026. Post-visit attribution, the measurement of what channels drive repeat behavior, is as commercially important as acquisition attribution. It is also nearly universally ignored.
The POS transaction is the actual conversion event. Every upstream touchpoint should be traceable to it, even approximately. MTA's job is to ensure that when a guest who watched a TikTok, searched Google a week later, and redeemed a promo code converts, the TikTok receives some credit rather than none. A platform like Feastalytics, a restaurant analytics tool that unifies POS, delivery, and marketing data to tie individual campaigns directly to in-store revenue, is built around making that traceability operational rather than theoretical.
The Structural Problem of Closing the Loop at a Physical Location
E-commerce has a checkout event. Restaurants have a door swing. Most attribution infrastructure was built to track the former, which is why closing the loop in a restaurant context requires deliberate workarounds.
Four mechanisms do this with varying degrees of precision.
Reservation tracking via UTM-tagged links is the cleanest solution available. A UTM parameter appended to a booking link in a Meta ad creates a direct attribution path traceable in Google Analytics when the reservation is completed. Per Stackatix data from 2026, this is one of the most accessible methods for operators without sophisticated tooling, because it leverages infrastructure most restaurants already have or should have.
Promo code redemption is the simplest. Every unique code tied to a specific campaign or channel creates a trackable conversion event at the point of sale. It requires no advanced platform integration. It does require discipline in code creation and staff training at the POS.
WiFi matching connects digital ad audiences to in-venue visitors through network connectivity. In one example cited by MyWiFi Networks in 2026, 60 of 400 weekend WiFi guests matched against an Instagram campaign audience, producing an attributed cost-per-visit traceable against average check revenue. The math is imperfect, but it is better than no math.
Offline Conversions API (Meta's CAPI and Google Customer Match) allows operators to upload hashed customer data, specifically email addresses and phone numbers, to match against ad audiences after the fact. Meta's offline events reporting showed a 15–25% improvement in campaign optimization versus online-only signals, per Meta Marketing Science data cited in MyWiFi Networks, 2026. Setup is more involved, but for operators with even a modest customer email list, this is among the highest-leverage attribution investments available.
It is also worth considering two developments that lower the barrier to entry further. As of September 2025, Google automatically enables store visits as a conversion action for eligible advertisers, removing a setup step that many restaurants never completed. Meta Store Traffic campaigns offer similar functionality through business location setup in Ads Manager, with Meta reporting meaningful foot traffic improvement for campaigns using offline attribution data.
One critical caution: platform-reported store visits are not additive. The same guest may be counted by Meta and by Google simultaneously. Summing those figures produces an inflated visit count, not an accurate one. Incremental lift tests, using geo-based holdouts or synthetic control groups, are the defensible method for validating true causal impact. This is not beginner-level work, but ignoring it leads to meaningfully wrong conclusions about campaign performance.
What Operators Can Build Before Spending on Dedicated Attribution Software
The minimum viable attribution stack for a restaurant does not require a proprietary platform. It requires deliberate use of tools that are already free or nearly free.
GA4 is the connective layer. It tracks website behavior, UTM parameters from reservation links, and conversion goals. Most restaurant operators who have GA4 installed have not configured conversion goals to fire on reservation completions. That configuration is where the measurement begins. One high-end steakhouse combined GA4 with OpenTable reservation data and identified a 15% lift in online bookings after isolating top-performing campaigns, per Zigpoll data from 2026. No proprietary attribution platform was involved.
The practical minimum viable stack: UTM-tagged URLs on every ad linking to reservation platforms; GA4 with conversion goals set to reservation completions; promo codes unique to each campaign or channel; and Meta Pixel with offline events enabled where feasible.
But what if that stack still leaves gaps? It will. Free tools handle lower-funnel attribution reasonably well. They struggle with view-through credit, multi-session journeys that do not include a trackable click, and cross-device identity continuity. The honest framing is this: free tools are a starting point, not a complete solution. They are, however, categorically better than relying exclusively on platform-native dashboards that report only within their own walls. Sixty-three percent of marketers describe their ideal attribution method as one that tracks customers across the full funnel, per a Bazaarvoice survey cited in BlueConic data from 2026. Most restaurants are nowhere near that. Which means even a partial, carefully constructed setup creates a real competitive advantage relative to the field.
How to Read the Data Without Letting It Lie to You
The core question MTA data should answer is narrow: which channel combinations drive actual in-store revenue? Not which channels drive the most impressions. Not which channels drive the most clicks. Which combinations show up repeatedly in paths that end in a POS transaction.
Reading attribution reports honestly requires a specific orientation. Look for touchpoints that appear most frequently in converting paths, not those that receive the most last-click credit. Look for channels that appear early in converting journeys even when they never receive last-click credit; these are the top-funnel awareness drivers that last-click models have trained operators to defund, often incorrectly. Compare the channel composition of converting paths against non-converting paths to identify what drops off or is absent before a guest fails to book.
On ROI: the honest formula for a digital campaign is attributed in-store revenue minus total campaign cost, including production and labor, divided by total campaign cost. Leaving production or agency fees out of the denominator produces misleading numbers. A marketing ROI of 300–500% on digital campaigns represents solid performance for most restaurants, per ChowNow data from 2026. That benchmark shifts substantially when retention is factored in; platforms integrated with loyalty and CRM data report dramatically higher ROI on retention marketing relative to acquisition, per Bloom Intelligence data from 2025, which is an argument for building post-visit attribution infrastructure alongside acquisition measurement, not after it.
The most common misread: treating platform-reported store visits as additive and summing them across channels. Do not do this. The decision rule that holds up over time is simpler than it sounds: use attribution data to double down on channel combinations that appear repeatedly in converting paths, and deprioritize channels that appear only in non-converting paths. Do not eliminate any channel based on a single campaign's results.
Where Multi-Touch Attribution Breaks Down, and the Honest Response
MTA is strongest on digital, user-level, trackable interactions. It weakens at the edges: word-of-mouth referrals, outdoor signage, a friend's recommendation, a review read on a device that cannot be tied to the converting session. These touchpoints are real. They are frequently significant. They are, structurally, invisible to MTA.
Match rate ceilings compound the problem. Meta Custom Audiences match between 40–60% of emails and 60–75% of phone numbers; Google Customer Match matches between 35–55% of emails, per Meta Marketing Science and Google data cited in MyWiFi Networks, 2026. A meaningful share of actual customers will never be matched to an ad audience. The measurement gap is structural, not technical.
One might argue that imperfect attribution is not worth the setup cost. That argument is worth taking seriously. MTA alone cannot prove causation; it can show correlation between touchpoints and conversions, but not whether the ad caused the visit or whether the guest would have come regardless. The causal gap is real.
The sophisticated response to that gap is triangulation: combining MTA with marketing mix modeling for macro-level channel trend visibility and incrementality testing to validate causal impact through controlled experiments. This is where the craft of measurement is heading, not a prerequisite for starting.
The practical response for most restaurant operators is simpler: treat MTA outputs as directional signals accumulated across multiple campaigns over time, not as precise financial verdicts from a single campaign. The value is in the pattern, not the point estimate.
The alternative to imperfect attribution is not perfect measurement. It is no measurement, which is how ad spend becomes guesswork, and how a Friday night full dining room remains permanently disconnected from the TikTok that had something to do with it.