Measuring Offline to Online Conversion for Restaurants
Dynamic QR codes and UTM tags bridge offline marketing to online orders.
There is something almost philosophically comic about a restaurant operator who spends real money on table cards, window clings, and a local radio spot, then opens Google Analytics and hands all the credit to organic search. The offline world did the work. The digital record got the trophy. This happens constantly, and it happens because the tools to bridge those two worlds exist but haven't been assembled with any intention.
Start with the scale of the problem. The National Restaurant Association's 2025 off-premises data puts 75% of restaurant traffic in takeout, delivery, and drive-thru channels. Online ordering accounted for 27% of all transactions in 2023, and digital ordering has grown roughly 300% faster than dine-in since 2014. Discovery, however, still happens in the physical world: a table card catches someone's eye, a direct mail piece lands on a counter, a server mentions the app. The conversion follows days later, on a phone, attributed to whatever digital channel the customer happened to touch last. The operator spent on print. The digital channel got the credit. Nobody noticed because there was no wire connecting the two.
This is not a channel problem. It is a measurement problem, and a failure of assembly.
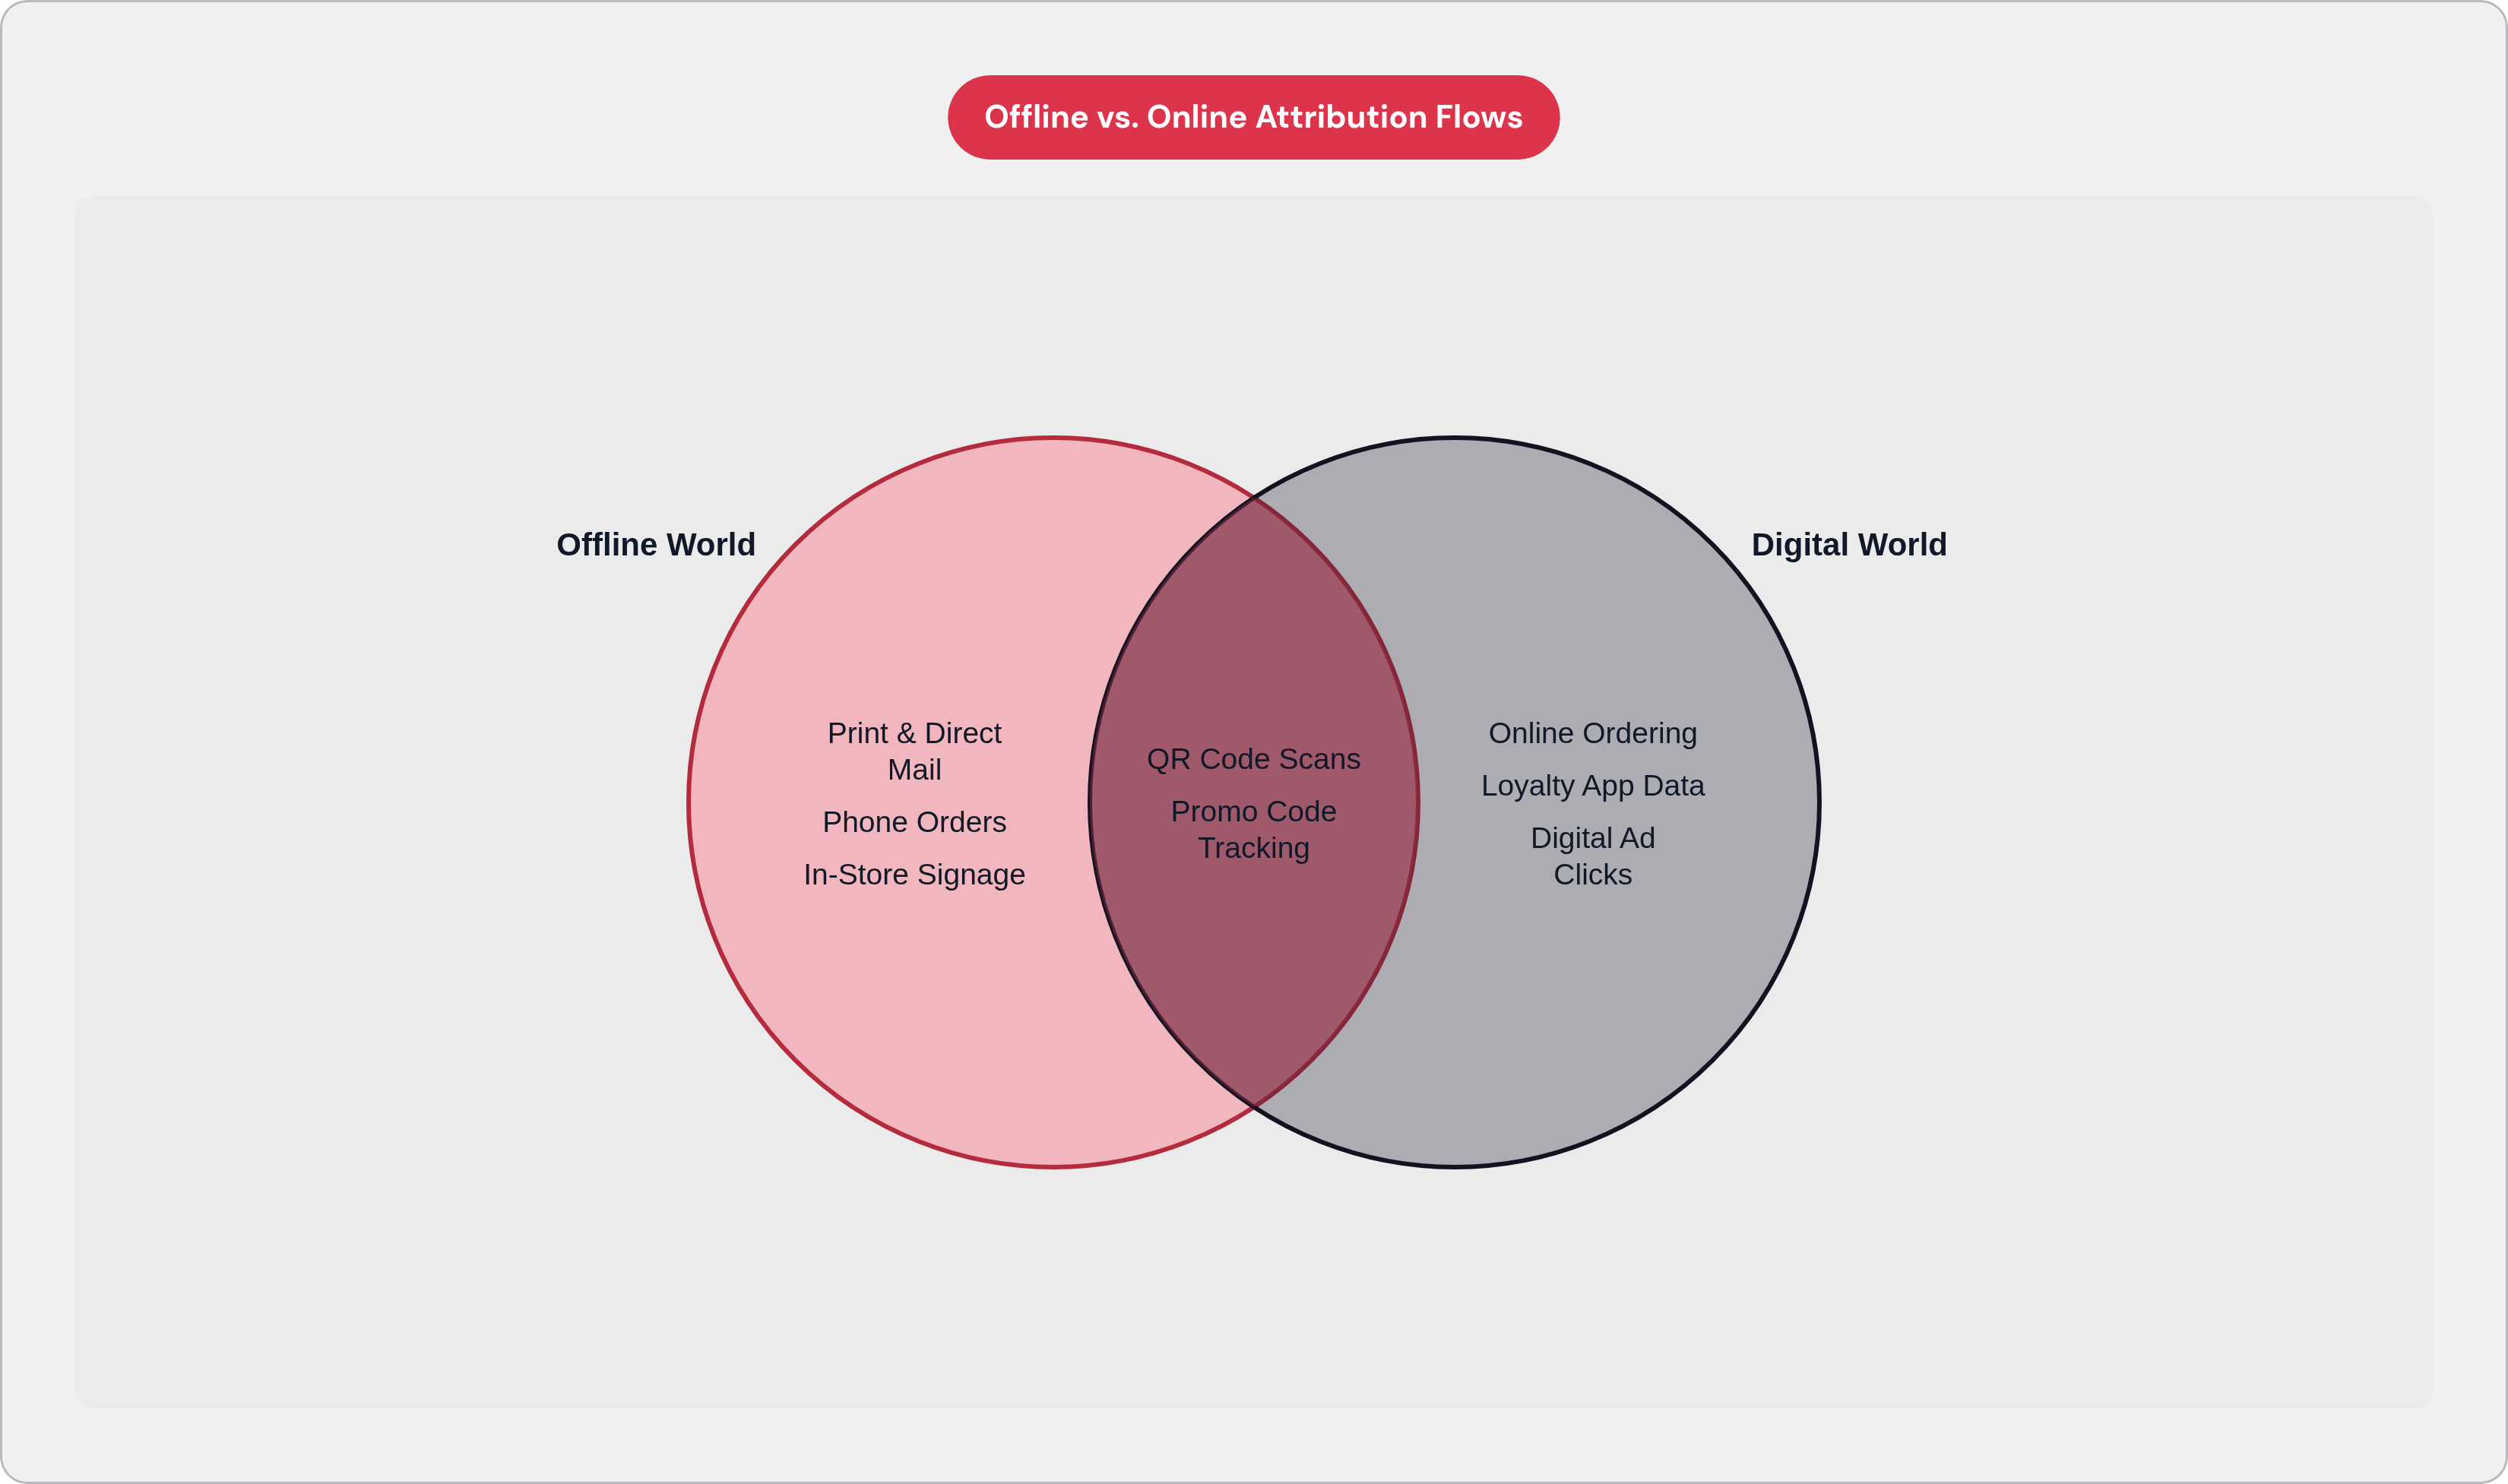
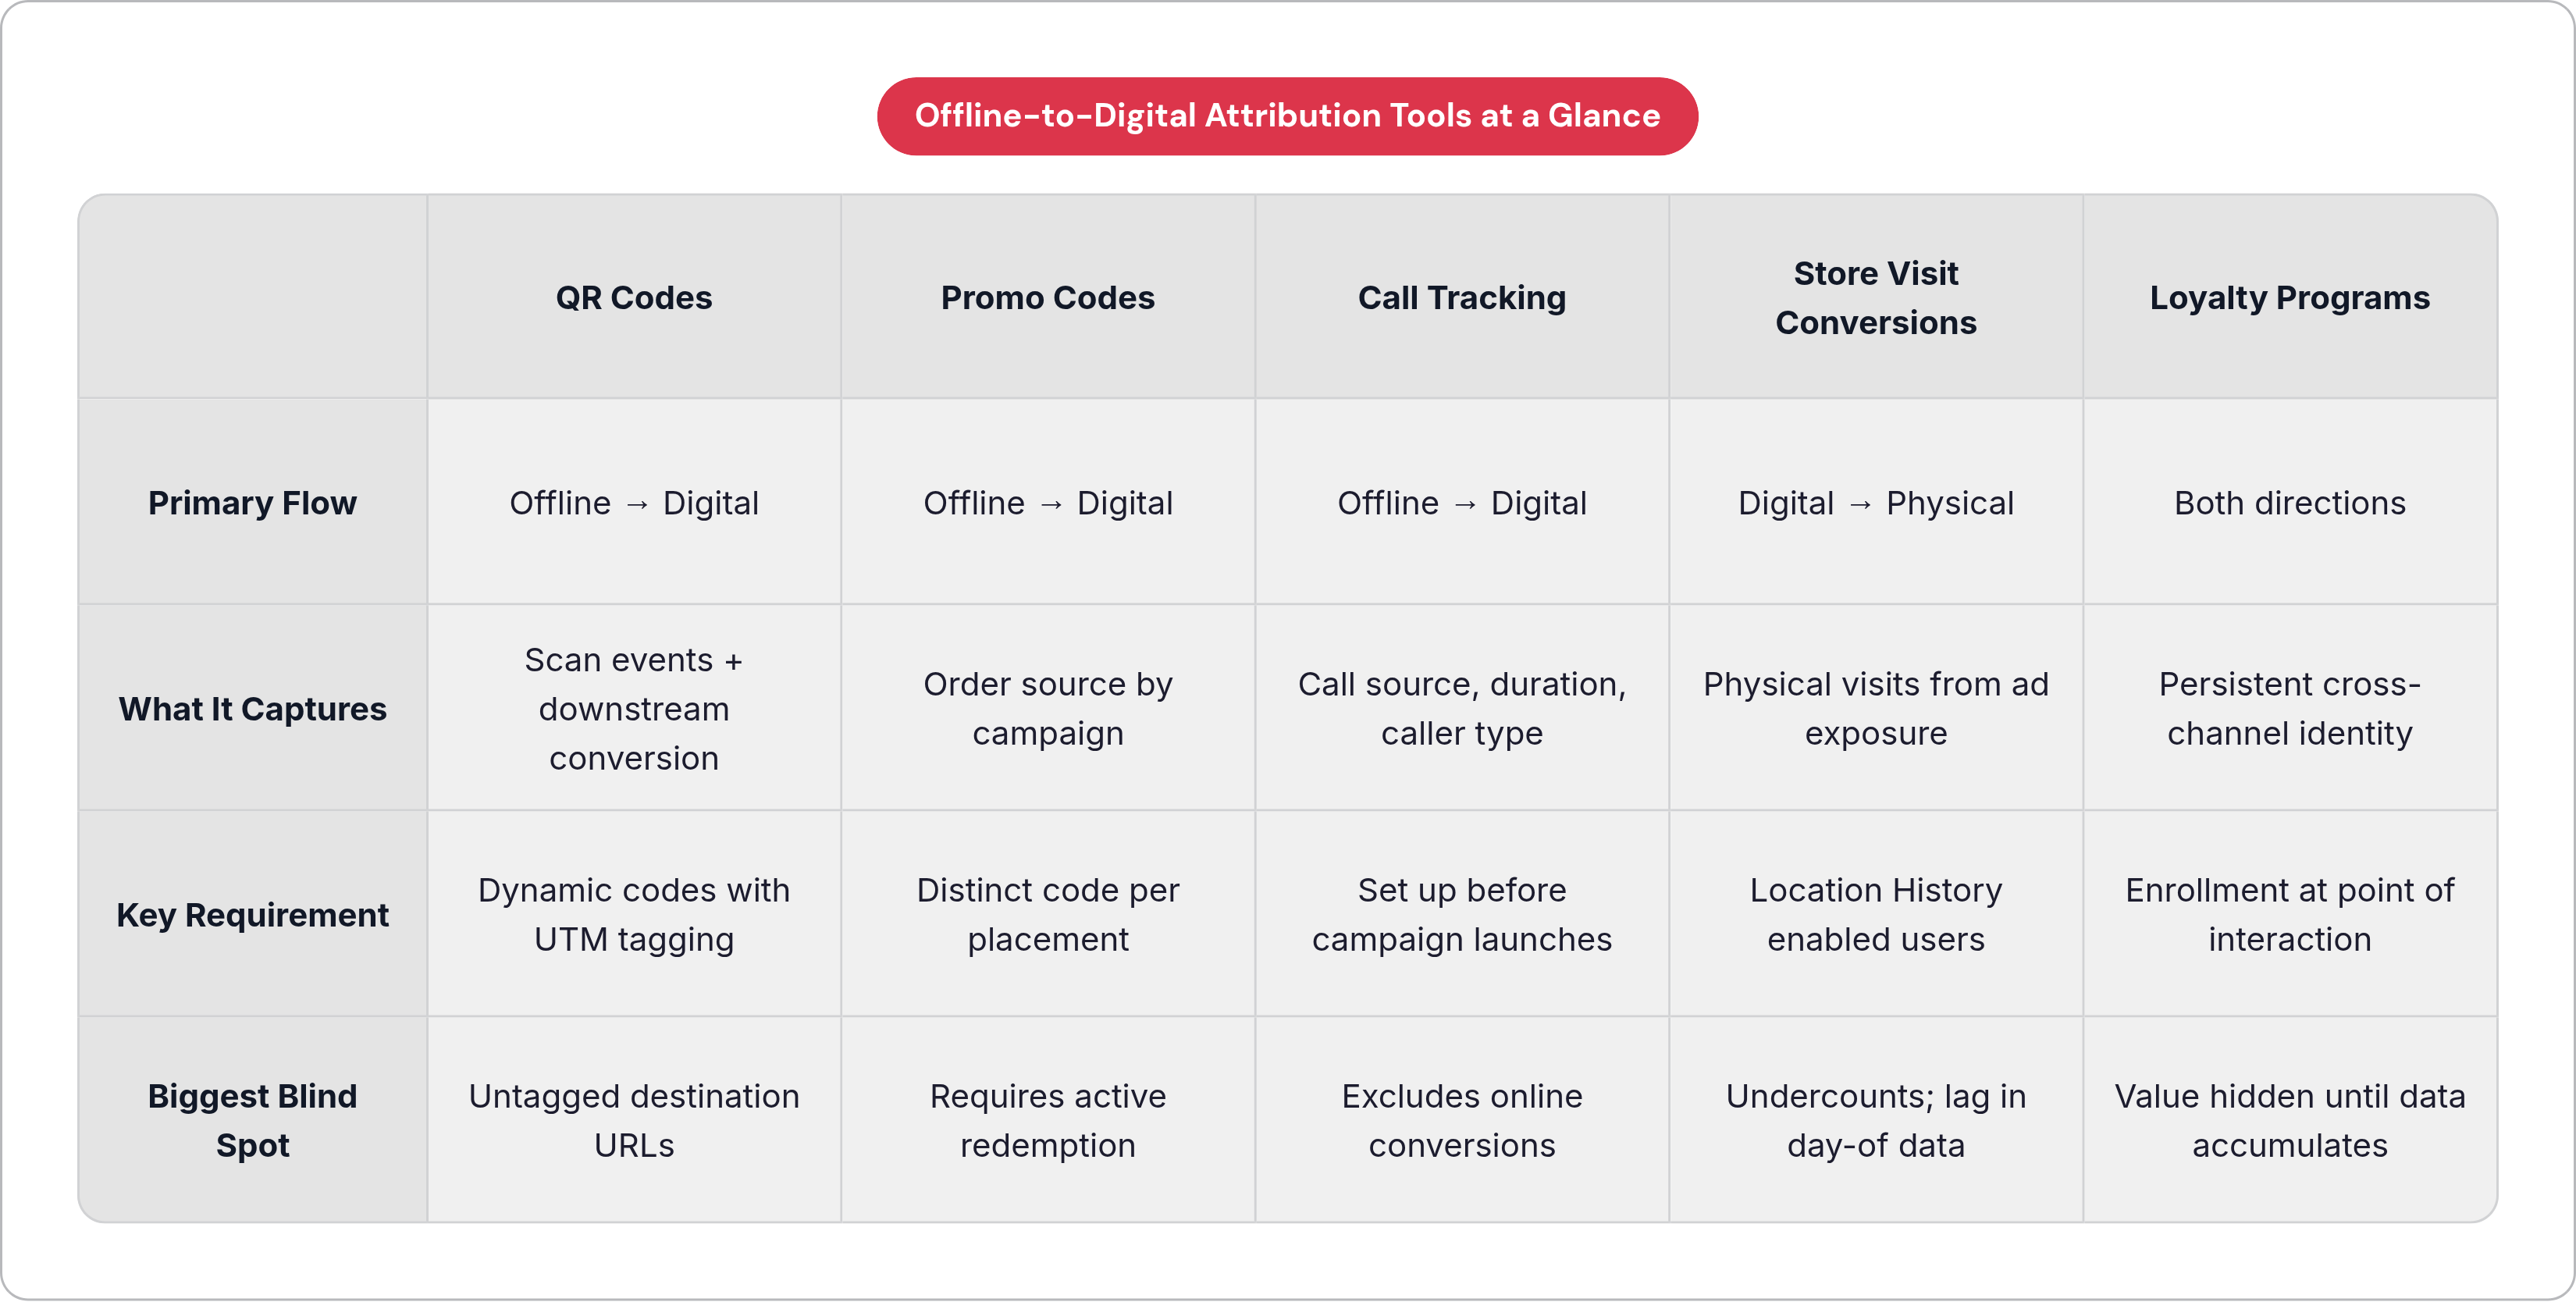
To understand why it persists, it helps to name the two flows separately. Flow A: a walk-in or phone customer becomes an identified digital orderer or loyalty member. Flow B: a digital ad drives a physical visit or offline transaction. Both share the same core challenge, which is bridging a digital signal to a real-world behavior, or vice versa. The goal is not to instrument everything for its own sake. The goal is to stop paying for marketing you cannot measure.
QR codes are the simplest bridge available: a printed, physical asset that generates a measurable digital event the moment someone scans it. Most operators already deploy them for menus, and a sizable majority of diners now prefer them over paper. The scan behavior exists. The opportunity is to instrument it properly, which almost no one does.
The critical distinction is between static and dynamic codes. Static QR codes encode a fixed URL; if the destination isn't instrumented, scan data is essentially lost. Dynamic codes decouple the printed pattern from the destination, so the target URL and its attached UTM parameters can be modified without reprinting anything. Dynamic codes also surface real-time analytics: scan volume, time of scan, device type, and downstream conversion if the landing page is tagged correctly.
The measurement payoff is not the scan itself. It is what happens after. A scan from a table card routing to a loyalty enrollment page tells you how many dine-in guests converted to identified digital members. A scan from a takeout bag routing to the online ordering flow tells you how many physical interactions converted to digital orders. A scan from a printed receipt routing to a feedback form ties post-visit sentiment to a specific location or daypart. Enterprise-grade attribution platforms can connect each scan to downstream outcomes, including app installs, in-app purchases, and loyalty sign-ups, rather than reporting only raw counts.
But what if the QR code routes to an untagged URL? Then it is just a link. Each physical placement gets its own code, each code routes to a destination carrying structured UTM parameters, and those parameters feed into whatever analytics layer the operator runs. A table card, a window cling, and a direct mail insert are three separate placements and therefore three separate codes. That granularity is the point.
Every Physical Touchpoint Deserves a Tag Before It Goes to Print
Unique promo codes are the analog equivalent of a UTM parameter: a human-readable string that, when entered at checkout, maps the order back to its source. A local newspaper ad carries one code. In-store signage promoting the app carries another. A direct mail drop gets a third. A server verbal offer, if the code is distinct, can even track staff-driven upsells.
One instinct worth challenging: the assumption that promo codes require a discount to function. They do not. A code can unlock a free item, a loyalty bonus, or early access to a new menu item, preserving margin while still generating the tracking event. The discount is optional. The tracking event is the whole point.
UTM parameters handle the digital side of the same journey. Any URL printed on offline collateral, whether on a menu footer, a receipt, or a direct mail piece, should carry structured UTM tags before it is finalized. Standard parameters cover source, medium, campaign, and content, which allows operators to distinguish not just between a postcard and a print ad but between two versions of the same postcard.
Where the two tools converge is worth noting explicitly. A QR code scanned from a postcard can carry UTMs in the destination URL and prompt for a promo code at checkout, producing a double attribution signal from a single physical touchpoint. That is not redundancy; that is confirmation. The habit to build is simple: treat every physical-to-digital path as a URL that needs to be tagged before it goes to production. If it is printed, it should be tagged.
The Phone Call Is the Conversion Nobody Is Measuring
Phone orders and catering inquiries are among the highest-value transactions a restaurant generates, and they are nearly invisible to standard digital analytics. A guest calls to book a private dining room for forty people. That call came from a local magazine ad. The restaurant's analytics platform recorded nothing. The magazine gets no credit. The catering director has no idea what drove the inquiry. This is an embarrassingly common situation.
Call tracking resolves this by assigning a unique forwarding number to each marketing source. The restaurant's actual phone still rings. The tracking layer captures source, call duration, time of day, and whether the caller is a first-time contact or a returning customer. A thirty-second call did not book a party of twenty. A twelve-minute call did. Duration matters, and most operators never look at it.
Google Ads provides built-in call conversion tracking for paid search, but offline sources, including print, direct mail, and in-store signage, require a separate call tracking platform. Services in this category integrate with Google Analytics and CRM systems so that call events can be treated as conversion goals alongside form fills and online orders.
It is also worth considering the conversion window. Local search behavior runs toward fast action: users who search for a restaurant on their phone frequently call or visit within roughly twenty-four hours. That compressed timeline means call tracking infrastructure needs to be in place before a campaign launches, not retrofitted after the fact. Attribution that starts late starts with a gap.
Digital Ads Can Move Physical Bodies, and Google Can Actually Measure It
Store visit conversions answer a different question than the tools above. Not "did this offline touchpoint generate a digital order," but "did this digital campaign generate a physical visit." It is Flow B, quantified.
Google models store visits by detecting, through aggregated and anonymized location signals, whether a signed-in user with Location History enabled subsequently visited a physical location after seeing or clicking an ad. The visit is matched back to the ad interaction and reported as a conversion type alongside online actions. It is not a perfect measurement, and Google does not claim otherwise. Users without location services enabled are not captured. This is an undercount rather than an overcount, which makes it a conservative and defensible metric rather than an inflated one.
There is a timing quirk worth understanding. Visits are attributed to when the click occurred, not when the visit happened. A Friday-evening click that produces a Saturday-morning visit shows in Friday's data. Operators reading campaign reports by day need to account for this lag, particularly when evaluating weekend-focused promotions. It sounds trivial until it distorts a campaign conclusion.
For restaurants specifically, the average cost per click in restaurant-category local search runs meaningfully lower than cross-industry Google Ads averages, which makes store visit data relatively affordable to generate at scale. When used with Performance Max campaigns, store visit tracking weights heavily toward Maps placements. Useful for local discovery, but worth monitoring to ensure Maps is adding incremental reach rather than cannibalizing existing traffic.
The pairing that matters most: store visit data alongside QR code and promo code data. If digital campaigns are generating physical visits but those visits are not converting to identified digital customers, the gap is in the in-store measurement infrastructure, not in the campaign.
Loyalty Is Not a Retention Tool. It Is an Identity Layer.
Every tool discussed so far generates a conversion event. A scan, a code redemption, a call, a store visit. Loyalty programs generate something more durable: a persistent identity, a customer record that can be matched across every subsequent visit, order channel, and touchpoint. The industry mostly sells loyalty on retention metrics. That undersells it considerably.
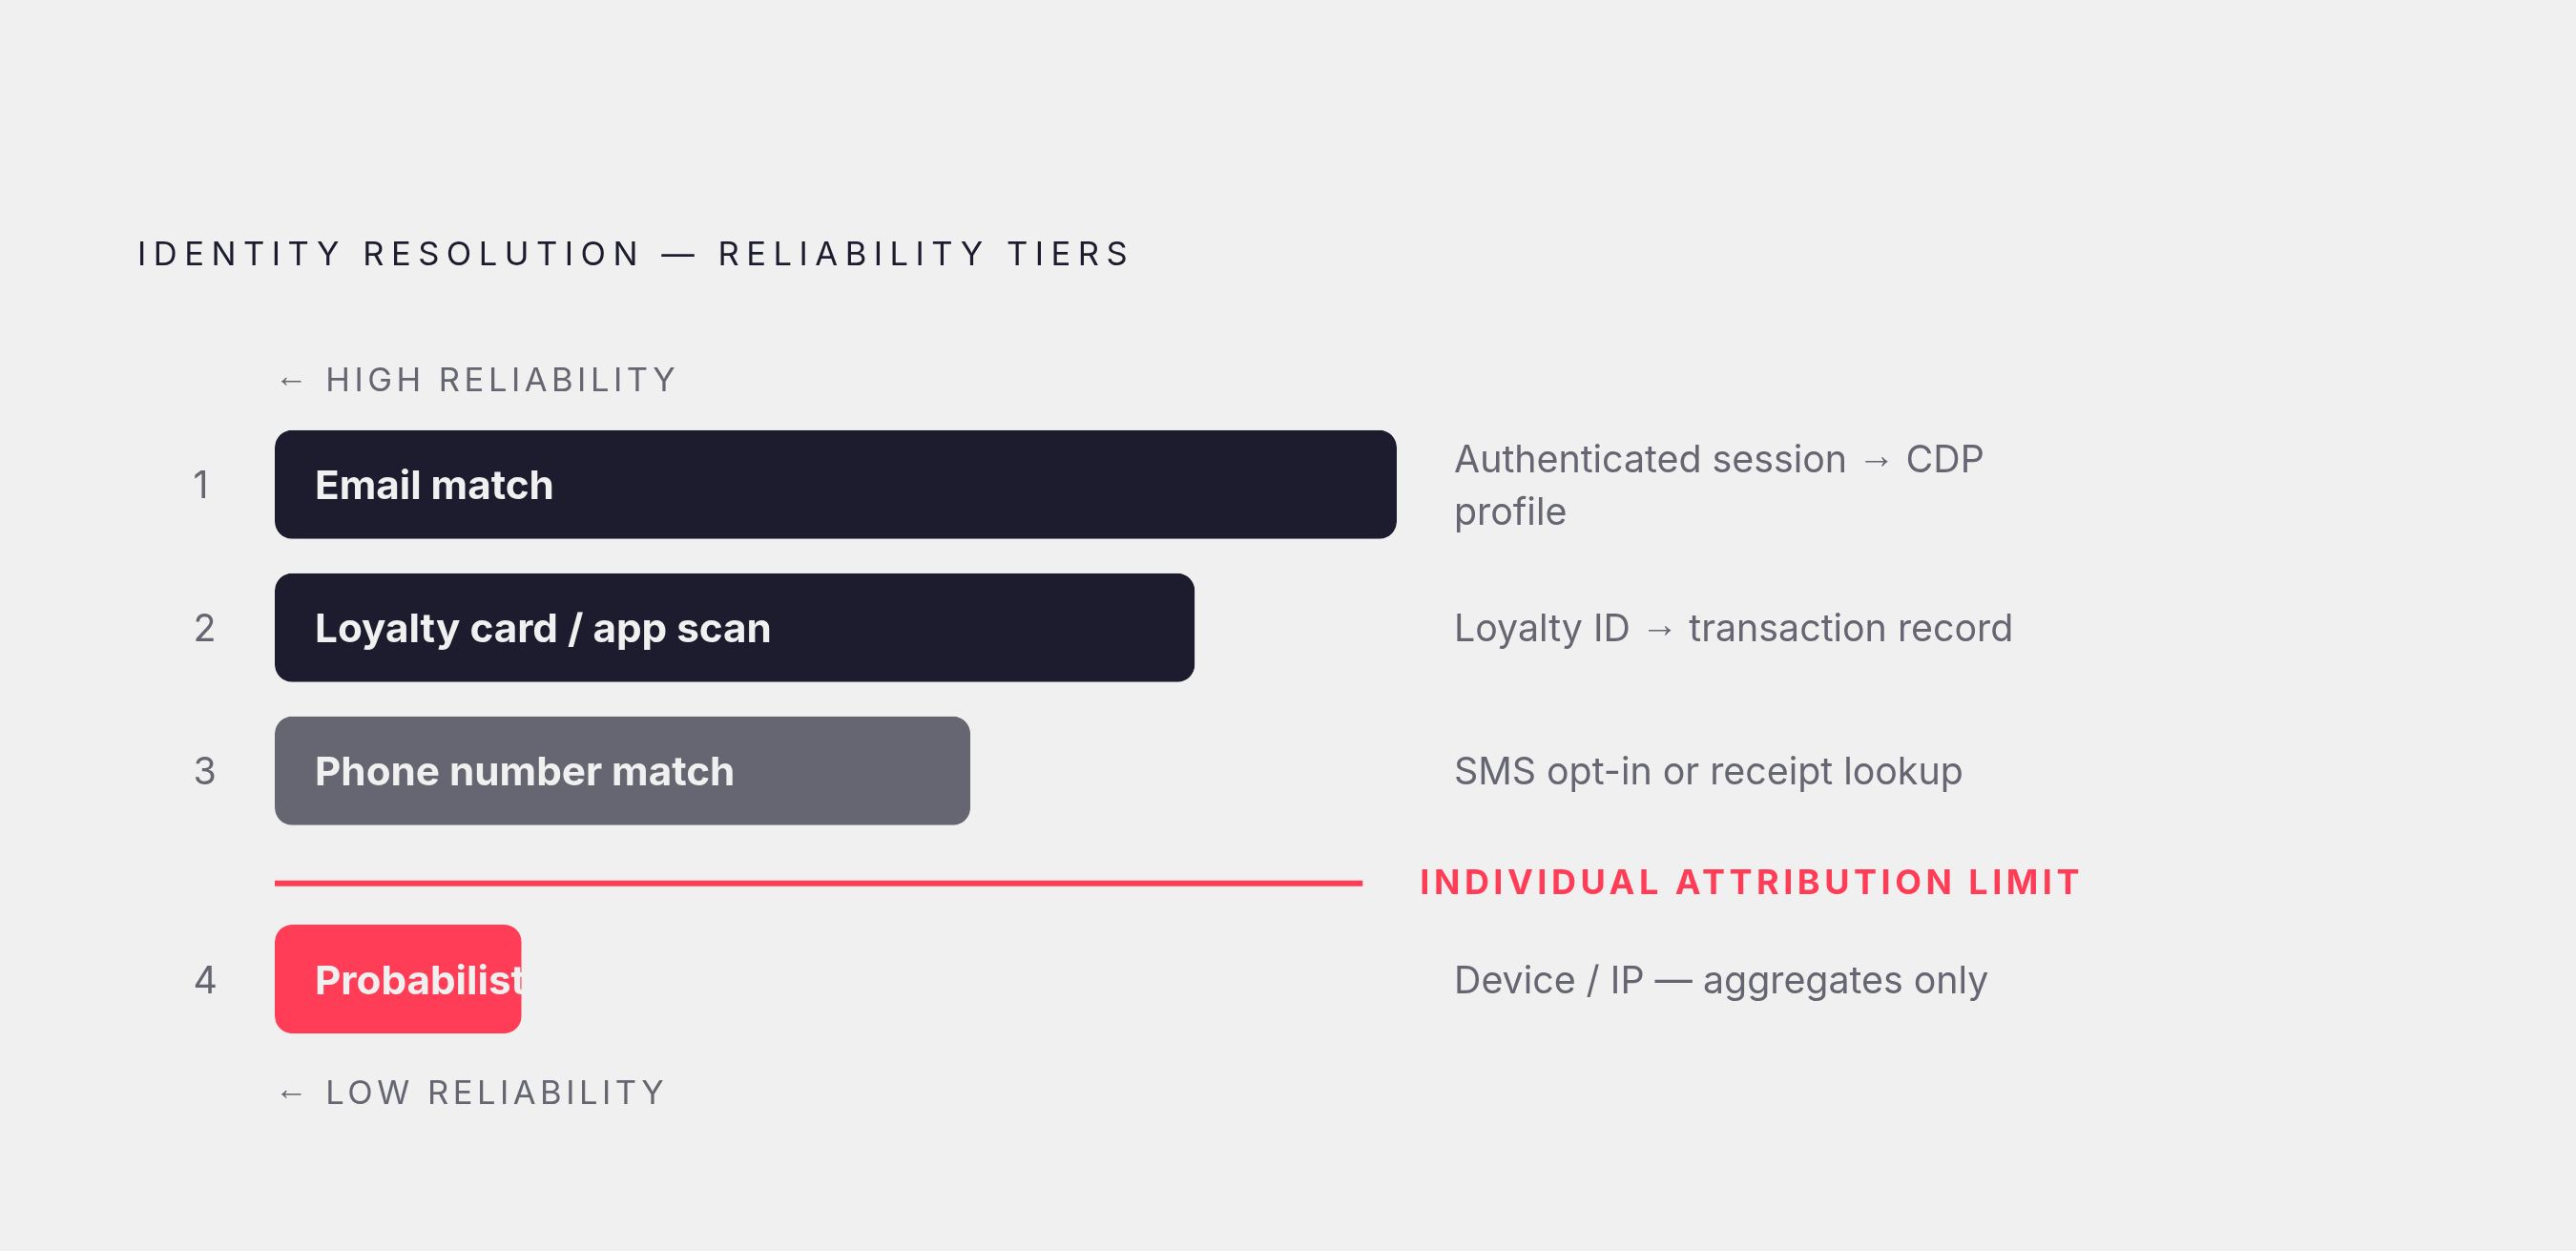
The identity-resolution hierarchy for restaurants runs roughly from most to least reliable. Email match, where a customer authenticates online and the address maps to an existing CDP profile, is the highest-accuracy signal. Loyalty card or app scan at the POS captures the loyalty ID and maps it to the transaction record. Phone number match through SMS opt-in or receipt lookup is a reliable middle tier. Probabilistic matching through device fingerprint or IP inference is useful for aggregate analysis but unreliable for individual attribution.
By 2025, roughly 71% of QSRs and 68% of full-service restaurants offer a loyalty program, with adoption projected to reach 80% by end of year. Loyalty enrollment reached 48% of diners in 2025, with weekly engagement at 47%. These figures suggest the infrastructure is effectively table stakes; the differentiation is now in how well that infrastructure connects to attribution, not whether it exists.
The behavioral case for investment is well established. Per Square and Restaurant Business survey data, loyalty members spend 40% more per visit and visit 64% more often than non-members. Antavo's 2026 report puts positive ROI at 92.7% of program owners, with an average return of 5.3 times. If the numbers are this clear, why do operators still treat loyalty as a marketing program rather than a measurement infrastructure? Probably because the enrollment moment feels like a hospitality interaction and the attribution value is not visible until later, once the data exists to run the comparison.
Loyalty is the only mechanism that makes a dine-in visit permanently attributable to a digital profile, completing the offline-to-online loop retroactively. That is a significant capability, and it is routinely left on the table.
Third-Party Delivery Is a Revenue Channel That Eats Your Data
Here is the tension operators do not talk about enough. Third-party delivery platforms hand the restaurant an order and keep the customer. Name, email, phone number, and order history stay on the platform's side. DoorDash does not share first-party customer data with restaurant operators. The order arrives. The customer remains a stranger.
The compounding effect is the real problem. As delivery volume grows, the share of identifiable customers shrinks. Operators end up knowing less about more of their revenue. Any offline-to-digital conversion that lands on a third-party platform is effectively invisible in the attribution stack: the restaurant cannot match that order to the QR code scan, the promo code impression, or the loyalty profile that preceded it. The measurement infrastructure built so carefully upstream terminates the moment the customer taps "order" on DoorDash.
The industry's response is visible in the data. Roughly 40% of brands identified first-party digital ordering as their top revenue growth channel for 2025, and the driver is not exclusively margin. It is data ownership. Restaurants with first-party ordering consistently show higher average order values, in the 15 to 22% range, driven by personalization and direct loyalty incentives that third-party platforms cannot replicate.
One argument holds that operators should simply stop using third-party platforms. That argument loses the moment it encounters real market conditions. The reach and discovery function these platforms provide is not easily replicated organically. The honest framing is this: use third-party platforms for discovery and volume, but design every offline touchpoint to route the customer toward the first-party channel where attribution is actually possible. QR codes on packaging, promo codes on receipts, in-store prompts at the moment of pickup: all of these can redirect a customer toward a channel the restaurant controls. The goal is migration, not refusal. There is a meaningful difference.
POS, CDP, and Geofencing: Where the Pieces Become a System
Individual tools are useful. The measurement architecture that actually closes the remaining gaps at scale, though, requires three components working in concert: a POS system that passes transaction data cleanly, a CDP that unifies it with every other channel, and geofencing or location-based signaling that captures physical presence without requiring an active scan or code redemption.
POS systems capture transaction data but rarely connect it to a customer's digital profile without a CDP or middleware layer in between. What a restaurant CDP does, at its most basic, is unify data from the POS, online ordering platform, loyalty program, reservations system, and marketing channels into a single persistent guest profile. That unification is what makes it possible to ask: did the customer who scanned a QR code on Tuesday and enrolled in the loyalty program on Thursday show up in person the following weekend? Without a CDP, that question requires manual cross-referencing across systems that were never designed to communicate.
Geofencing adds a dimension that QR codes and promo codes cannot reach. A geofence draws a virtual boundary around a physical location or a competitor's location. When a device with location services enabled crosses that boundary, a triggered event is logged; if that device is associated with a known customer record, the visit can be attributed to a specific marketing interaction that preceded it. For anonymous devices, the data feeds aggregate traffic analysis and audience modeling. Neither outcome is trivial.
But what if a customer visits without scanning, ordering, or triggering any deliberate interaction? This is the gap that probabilistic matching and geofencing are designed to address, imperfectly but usefully. No single tool closes it completely. What the combination of POS data, a CDP, and location-based signals provides is a system that makes anonymous visits progressively less anonymous over time, as more interactions accumulate and more identity anchors are established.
Assembled intentionally, this infrastructure looks like: QR codes and promo codes generating tagged, attributable entry points; call tracking capturing phone-driven conversions; Google store visit data quantifying the physical lift from digital spend; loyalty programs building persistent identity across every channel; first-party ordering protecting data that third-party platforms would otherwise absorb; and the CDP, connected to the POS and supported by geofencing, stitching it into something approaching a complete picture.
Approaching, not achieving. Attribution is a model, not a fact. The gap between an operator running on intuition and one running on instrumented data is not the gap between wrong and right. It is the gap between a guess and an informed estimate, and in this business, that difference compounds quarterly. The tools are not exotic. Most of them are already in the building. Platforms like Feastalytics, a restaurant analytics platform that unifies POS, delivery, and marketing data to attribute campaigns directly to in-store sales, exist precisely to do that connecting. The question is whether anyone has bothered.