Attribution Challenges in Multi-Location Restaurant Groups
POS data silos mask which locations drive revenue, hiding underperformance for months.

The POS is, in theory, the authoritative record of in-store revenue. Every cover, every ticket, every table: it is all in there. In practice, at a multi-location group, that data rarely reaches the marketing layer in any useful form.
Systems like Toast and Square were built to process payments efficiently. Feeding structured, location-tagged transaction data into an ad platform's attribution model was not part of the design brief, and connecting them through APIs is an engineering problem that most growing restaurant groups simply lack the internal capacity to solve. So the data sits in separate silos, one per location, largely inert from a marketing measurement standpoint.
Why does this matter more at the group level than at a single location? Because the failure mode scales. Without a unified data layer, group operators end up with one of two inadequate pictures: an aggregated revenue report that masks which location benefited from which campaign, or a stack of location-level reports in incompatible formats that make cross-location comparison slow, manual, and error-prone. Neither produces the insight an operator actually needs.
The practical consequence is this: a campaign that looks profitable at the group level is probably carrying one strong location while quietly underperforming at two others — like a relay team where one runner is doing the work of three. And the operator will not know for months. Accurate ROI measurement starts with connecting marketing data to POS revenue and tracking revenue linked to customer touchpoints within a 30 to 90 day window. That approach produces far more defensible results than relying on platform-reported clicks, but it requires the data bridge to exist in the first place. Most groups have yet to build it, though platforms like Feastalytics, a restaurant analytics tool that unifies POS, delivery, and marketing data and ties campaigns directly to in-store sales, exist specifically to close that gap at the location level.
What a working architecture looks like, at minimum: each location's POS data flowing into a shared attribution layer, tagged by location identifier, so that revenue can be matched to the specific campaign that drove it at that specific address. Not the group address. Not a blended average. That address.
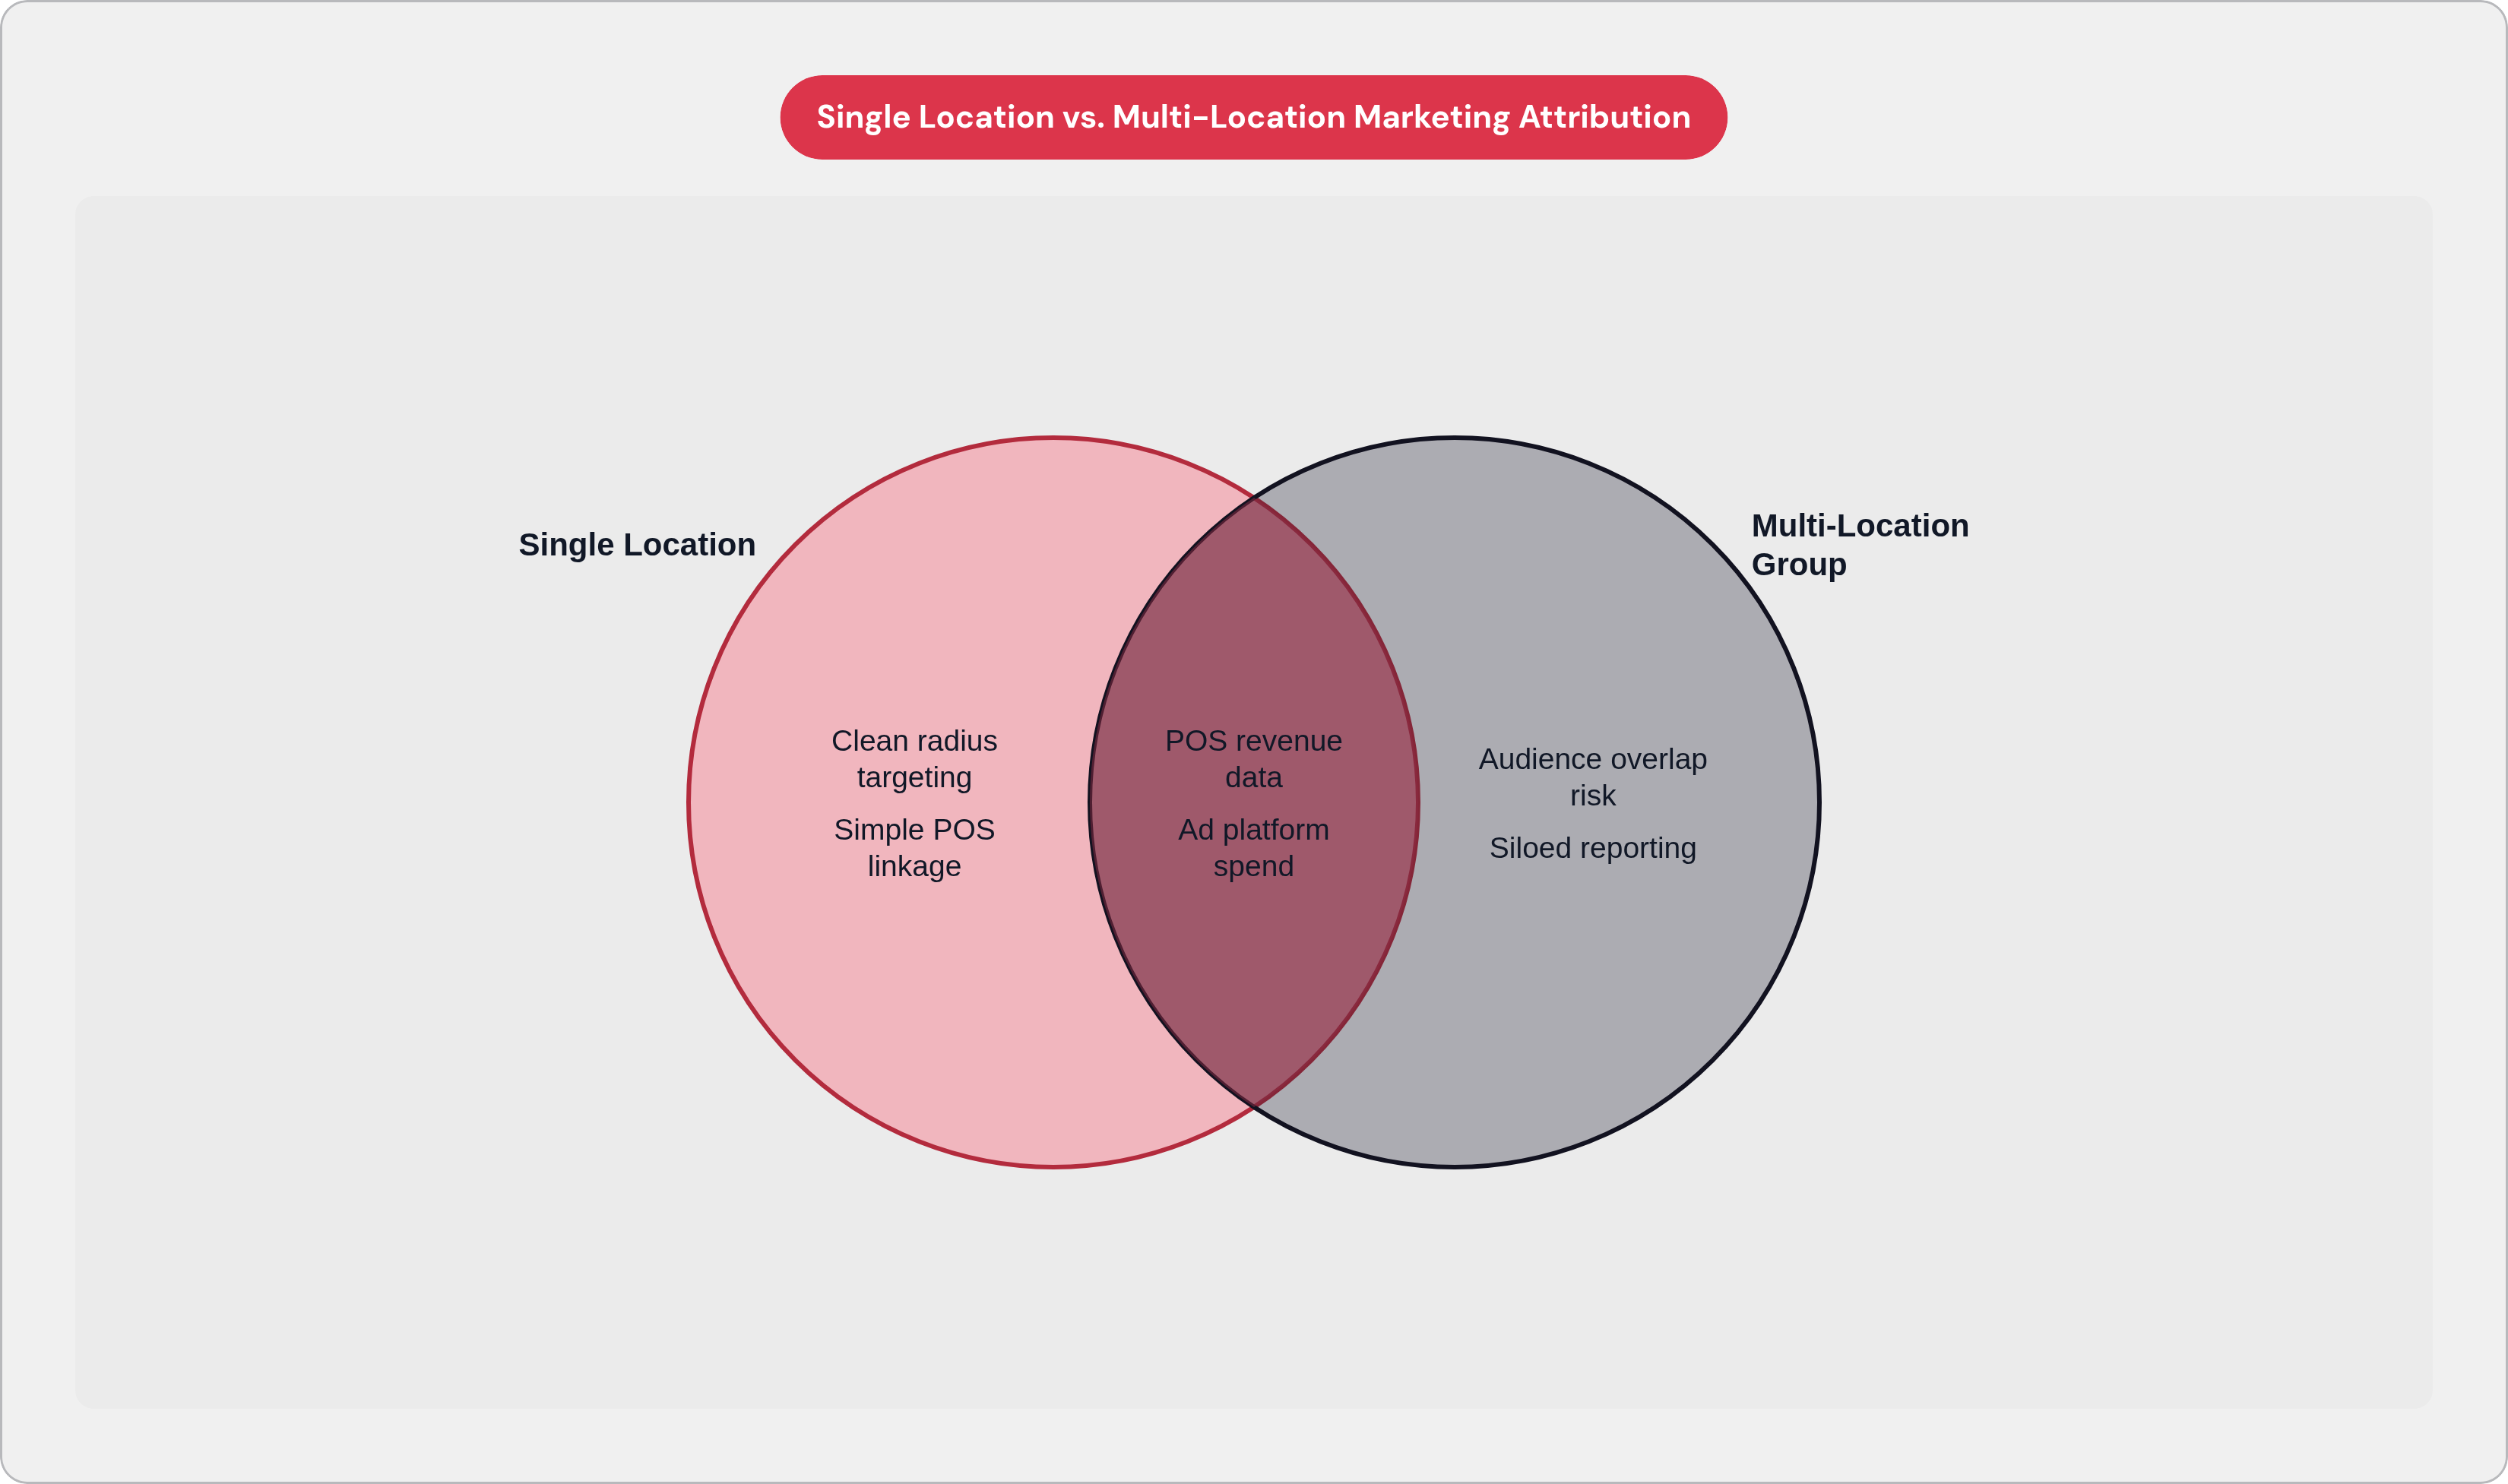
The Audience Overlap Problem: When One Campaign Steals Credit From Another Location's Table
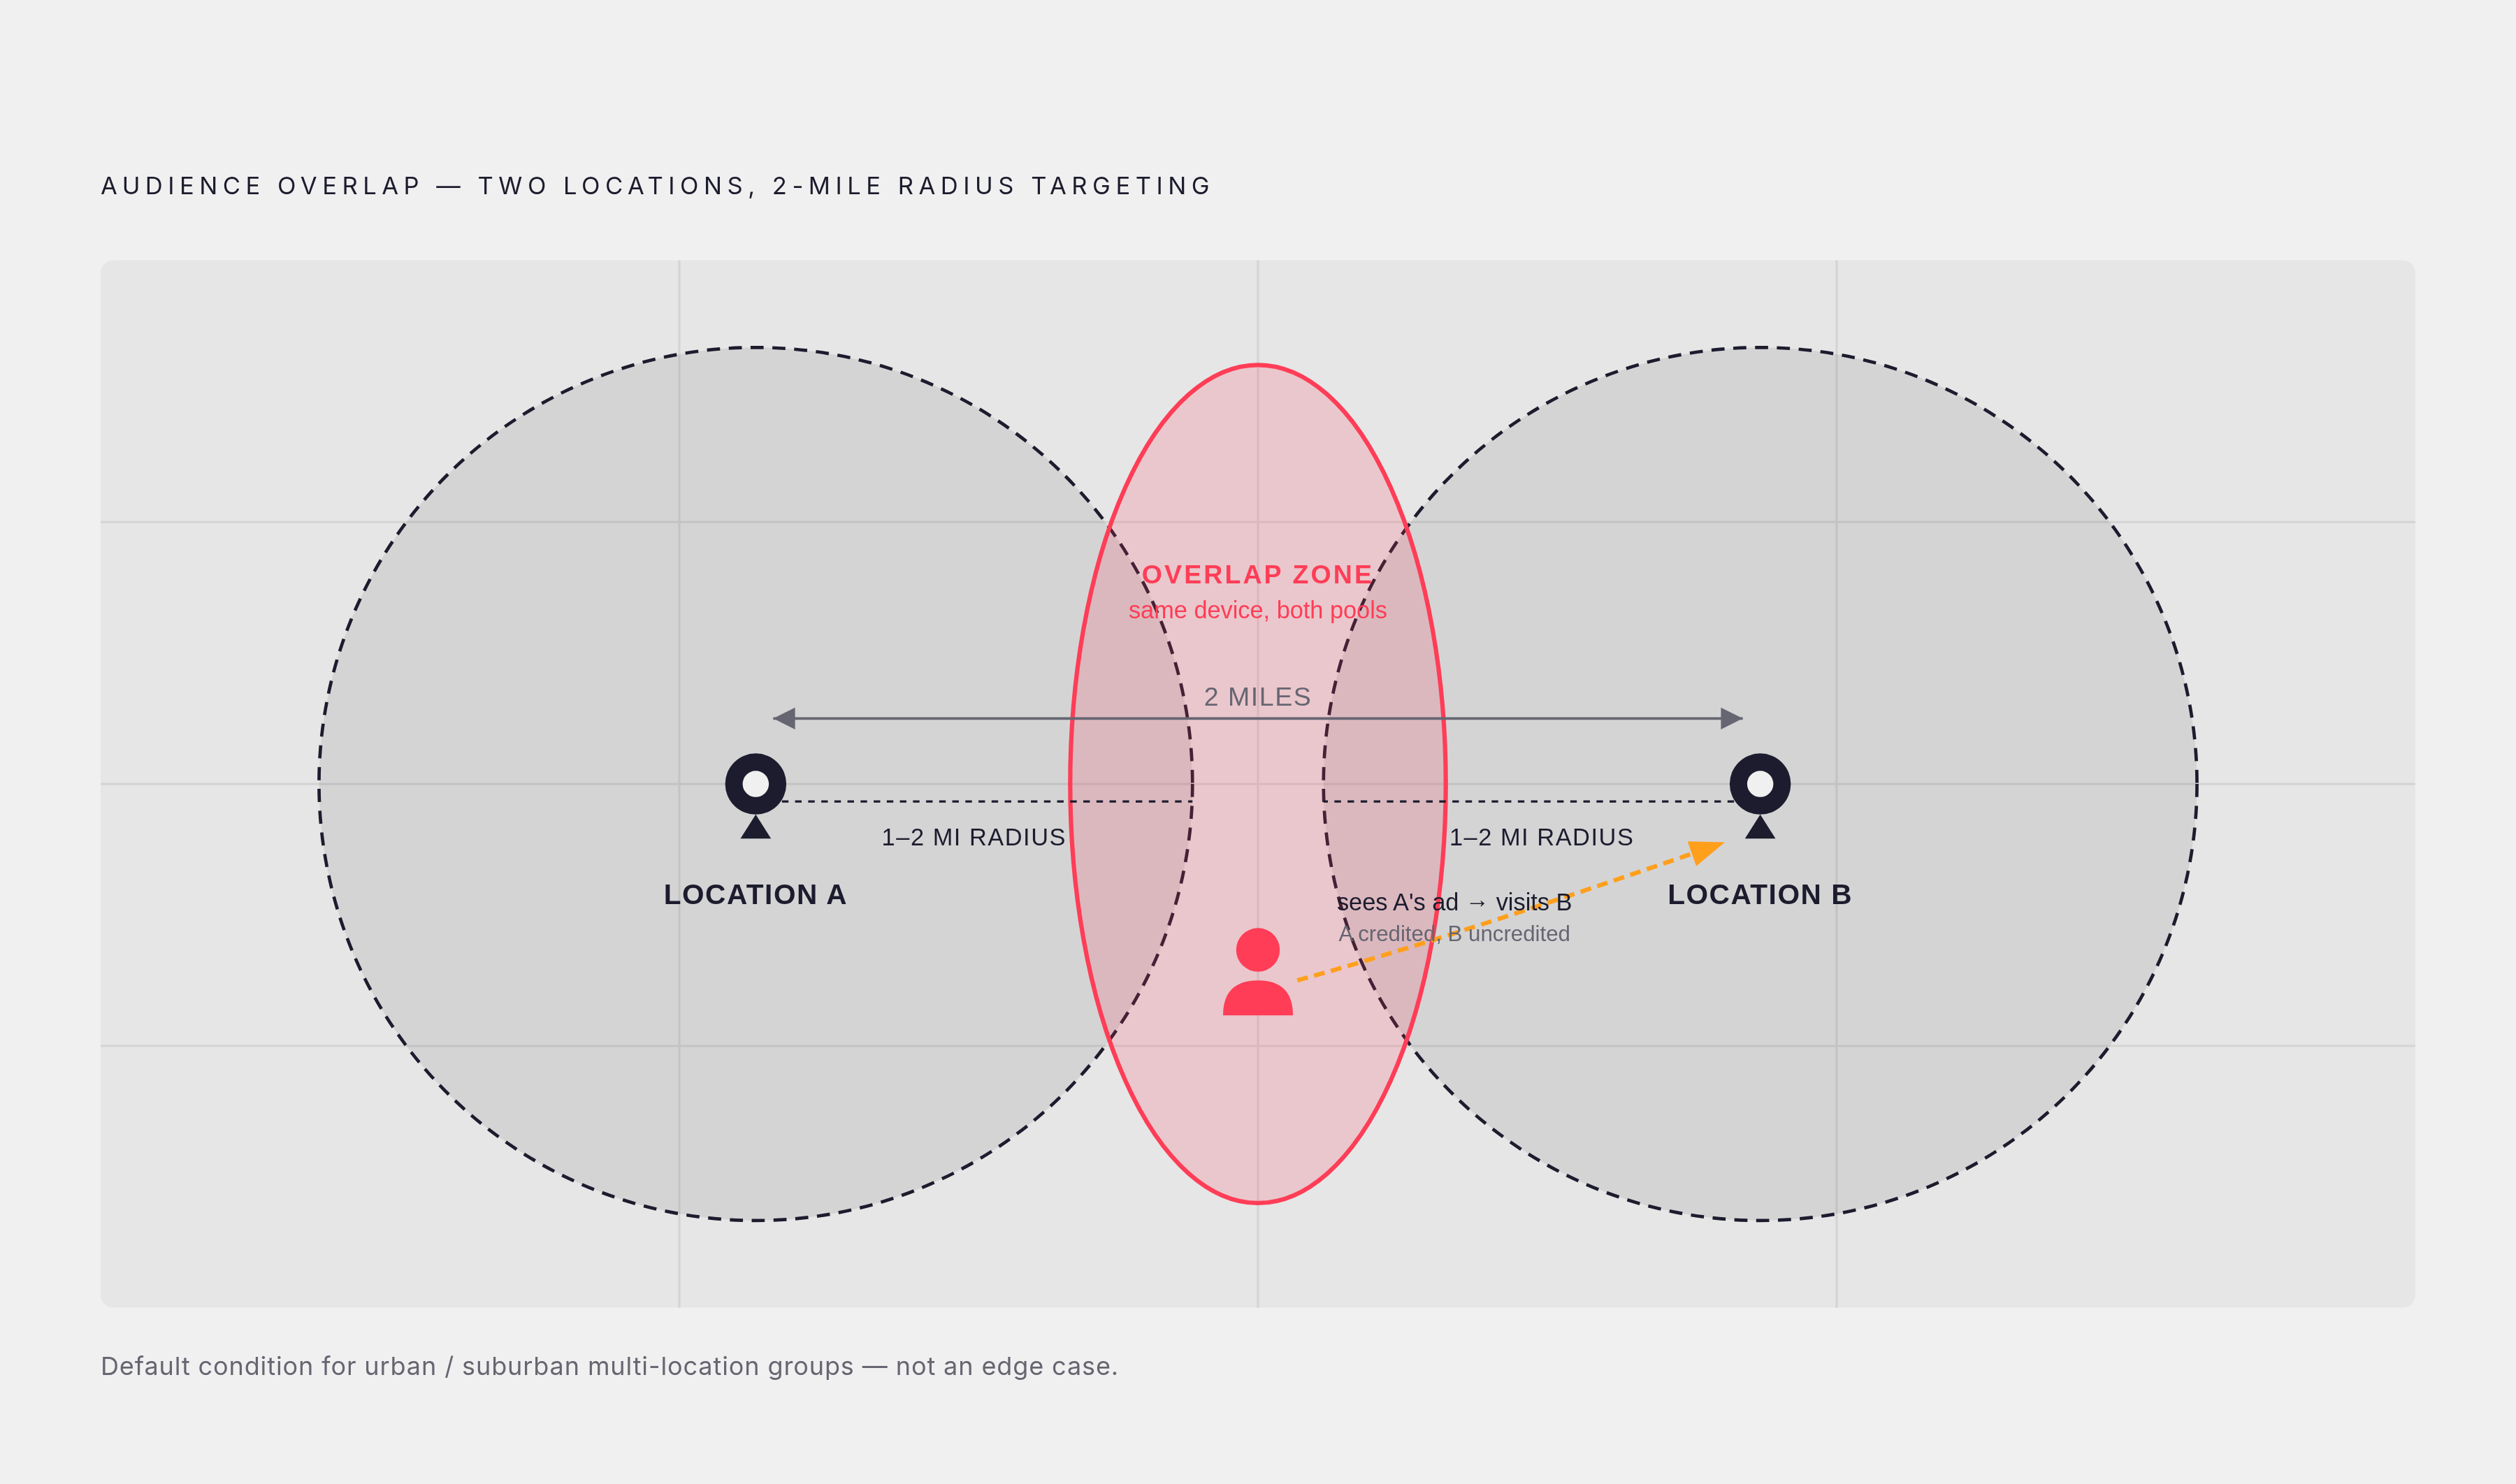
Radius targeting is the standard playbook for restaurant advertising on Meta and TikTok. Target people within one to two miles of a location, reach the people most likely to walk in, keep wasted impressions low. For a single location, the logic holds. Meta allows targeting within a one-mile radius, which for a single restaurant means near-zero geographic overlap with anything irrelevant.
For a group with two locations separated by two miles, those radii overlap substantially. The same device is simultaneously in the audience pool for both campaigns. That is not some edge case to be managed around. That is the default condition for most urban or suburban multi-location groups.
Consider what this does to attribution. A guest sees an ad for Location A, ends up near Location B that evening because of where they parked, and visits Location B instead. The platform records a conversion for Location A's campaign. Location A's ROAS looks inflated. Location B appears to be generating visits without paid support. Neither figure is accurate, and budget decisions made on these numbers can quietly move money toward the wrong location or the wrong ad set for months before anyone notices the pattern does not hold.
The multi-touch reality of modern restaurant marketing compounds the problem. Research consistently finds that guests interact with multiple digital channels before making a dining decision, often three or more touchpoints across different platforms. A guest sees Location A's Instagram post, Location B's TikTok, and a Google search result before walking in, and not one of the platforms involved will agree on who deserves credit. Meta defaults to a seven-day click and one-day view attribution window. Google uses data-driven attribution. TikTok uses a seven-day click and one-day view window. Comparing performance across these platforms without standardizing the attribution window produces figures that are meaningfully incomparable, let alone inaccurate at the location level.
That raises an important question: is the solution a better attribution window, or a different campaign structure altogether? Group-level ad campaigns run from a single account feel efficient because they reduce administrative overhead, but they produce attribution data that cannot be assigned to a specific location. To be measurable at all, campaigns must be structured per location, with non-overlapping geotargeting, from the start. The efficiency of a shared campaign is real. So is the cost of never knowing what it actually produced.
Siloed Location Reporting: Accountability Theater
The instinct when opening multiple locations is to give each one its own marketing budget and let the local manager run it. This feels like accountability. It surfaces a different problem entirely.
When each location operates as its own reporting island, there is no shared definition of what a conversion actually is. One manager counts covers. Another counts reservation clicks. A third opens their Meta dashboard, sees that impressions are up, and considers the campaign a success. These are not three versions of the same measurement; they are three incompatible ones. There is no way to compare cost per in-store visit across locations using consistent methodology, because the methodology was never agreed upon. What the best-performing creative or offer at Location A revealed rarely reaches Location C, because no mechanism exists for sharing what was learned.
The cumulative financial weight of this is worth examining directly. Bloom Intelligence, drawing on 2025 data, estimated that restaurants relying on fragmented systems face a 78.8% annual guest churn rate, translating to roughly $375,380 in lost opportunity per location annually. Those figures will vary by market and average check, but multiply even a conservative version across a group of five locations and you are no longer looking at a marketing line item. You are looking at a group-level financial exposure.
Here is the more honest way to describe siloed reporting: each location is running its own experiment, in its own language, in its own timezone, recording no results, and calling it a strategy. Spend accumulates. The operator cannot identify which location's marketing is working, which is wasting budget, or why. The experiments rarely conclude.
What Location-Level Accountability Actually Requires in Practice
Accountability at the location level starts with a definitional commitment: every location tracks the same metric. Not impressions. Platform-reported ROAS is off the table too. In-store revenue attributable to a specific ad, at a specific address. Everything else is noise until that baseline exists.
The technical minimum to make this work is less daunting than it sounds. Each location's POS connects to a shared attribution layer, tagged with a location identifier so revenue flows to the right unit. Campaigns are structured per location, not per group, with non-overlapping geotargeting. A consistent attribution window is applied across all locations and all platforms; standardizing on one window, or using a third-party tool that applies consistent logic, is the only way cross-platform and cross-location comparisons become valid.
But what if the technical lift still feels prohibitive? There is a low-engineering alternative that has worked reliably for decades: unique promo codes, one per location per campaign. Every redemption is a tracked, location-specific conversion. No API integration required. A QR code per location for offline or event-based campaigns serves the same purpose. These are not sophisticated solutions. They are functional ones, and functional beats sophisticated when the alternative is measuring nothing at all.
For operators willing to invest in more rigorous methodology, incrementality testing by location is among the most defensible tools available at this scale. Divide locations into exposed and control groups, run the campaign for one cohort, hold it back from the other, and measure the revenue difference. What this produces is a per-location cost-per-visit and per-location ROI that can be compared across the group and acted upon within a campaign cycle. One argument holds that incrementality testing is overkill for a group of three or four locations. But what is the alternative, exactly: continuing to average performance across locations and hoping the aggregate trend reflects something real?
How to Build a Unified View Across the Group Without Losing Location-Level Signal
One argument holds that the solution to fragmented location data is simply a better dashboard, something that aggregates all the location reports into a single view. That argument misses the problem. An aggregated view built on incompatible inputs does not produce clarity; it produces a tidier version of the same confusion — like mopping a flooded floor without turning off the tap.
The group-level view is not an average of location dashboards. It is a shared infrastructure that each location feeds into, while preserving the location tag on every data point. Revenue attributed to a specific ad at a specific location stays labeled as such; it does not collapse into a group total until the operator actively chooses to aggregate it. That distinction is what makes the unified view useful rather than decorative. The operator can ask which location is generating the highest ROI per dollar spent, which creative is working across multiple locations, and which location is underperforming relative to its market. None of those questions are readily answerable from a blended aggregate, regardless of how well-designed the dashboard is.
Multi-touch attribution at the group level follows naturally from this logic. Single-touch models, whether first-click or last-click, distort reality at the location level. A guest who encountered a TikTok from Location A, a Google ad, and an email before visiting Location B should not credit the entire conversion to whichever touchpoint the platform happened to record last. Multi-touch models credit the right location and the right channels proportionally, which is more complex to implement but considerably less misleading than the alternative.
One channel worth particular attention for multi-location groups: local creators whose audiences are geographically concentrated near a specific location. Content from a creator whose followers predominantly live near Location B drives visits to Location B, not Location A. The attribution is inherently cleaner than a group-wide paid campaign with overlapping radii, because the audience geography is determined by the creator's actual community rather than a radius drawn on a map. The measurement is imperfect. The directional signal, though, is more honest than most alternatives available at this scale.
What the Measurement Gap Costs a Multi-Location Group That Does Not Fix It
At five locations, Bloom Intelligence's per-location churn figure translates to nearly $1.9 million in preventable annual loss. That is not a marketing budget problem. That is a group-level strategic exposure, and it is partially attributable to the inability to identify and re-engage guests acquired through paid spend.
The ad spend dimension compounds this in a specific, operational way. Without location-level attribution, the rational response is to average spend across all locations and accept blended performance, which is functionally identical to subsidizing the losing campaigns indefinitely. There is no mechanism to reallocate toward what is working because there is no reliable signal about what is working. The budget distributes equally among the good bets and the bad ones, and telling the difference becomes genuinely difficult.
External conditions make the cost of inaction higher than it has historically been. The National Restaurant Association's 2026 State of the Industry reported that six in ten operators experienced softer customer traffic in 2025. Food-away-from-home prices rose meaningfully over the preceding year and a half, according to Bureau of Labor Statistics data summarized in McKinsey's 2026 restaurant outlook, making diners both fewer in number and more deliberate in their choices. When traffic is compressing and guests are scrutinizing the value exchange more carefully, a wasted impression or a misattributed table is a real dollar spent to fill someone else's table, or no table at all.
Groups with unified attribution can see per-location ROI, act on it within a campaign cycle, and carry those learnings forward. Ad spend, in that configuration, becomes a system that gets more efficient with each iteration because each result actually informs the next decision.
The POS has the revenue. The ad platforms have the touchpoints. Most groups have yet to decide to connect them. That is the gap, and it has a price.