Measuring ROI on Restaurant Digital Campaigns
Most restaurants measure campaign ROI using the wrong numbers and never know it.

There is a version of this conversation that goes well. An operator pulls up a campaign report, sees a tidy ROI number, feels good about it, and moves on. The problem is that the number is almost always wrong. Not fraudulently wrong. Just wrong in the quiet, compounding way that comes from measuring the easiest thing instead of the right thing. Clicks instead of covers. Impressions instead of incremental visits. Gross revenue instead of margin on the guests the campaign actually brought in.
Restaurant digital marketing has a measurement problem that most operators don't know they have, because the dashboards are full of numbers. Full dashboards feel like accountability. They rarely are. A dashboard full of vanity metrics is like a restaurant full of empty calories — it looks like nourishment, but nothing is getting fed.
What follows is a channel-by-channel framework designed to connect the right metrics to the right channels, and then show how those channels link into a full-funnel picture. The goal is not to make measurement more complicated. It is to make it honest.
The ROI Formula Every Operator Is Getting Wrong
The formula itself is straightforward: ROI equals attributed revenue minus ad spend, divided by ad spend, multiplied by 100. Three variables. One of them is doing almost all of the work.
The word "attributed" is the problem. Total restaurant revenue is not the input. The incremental revenue tied to the campaign is the input, a measurement approach known as incrementality testing when applied rigorously. The gap between them is where most ROI calculations go quietly off the rails.
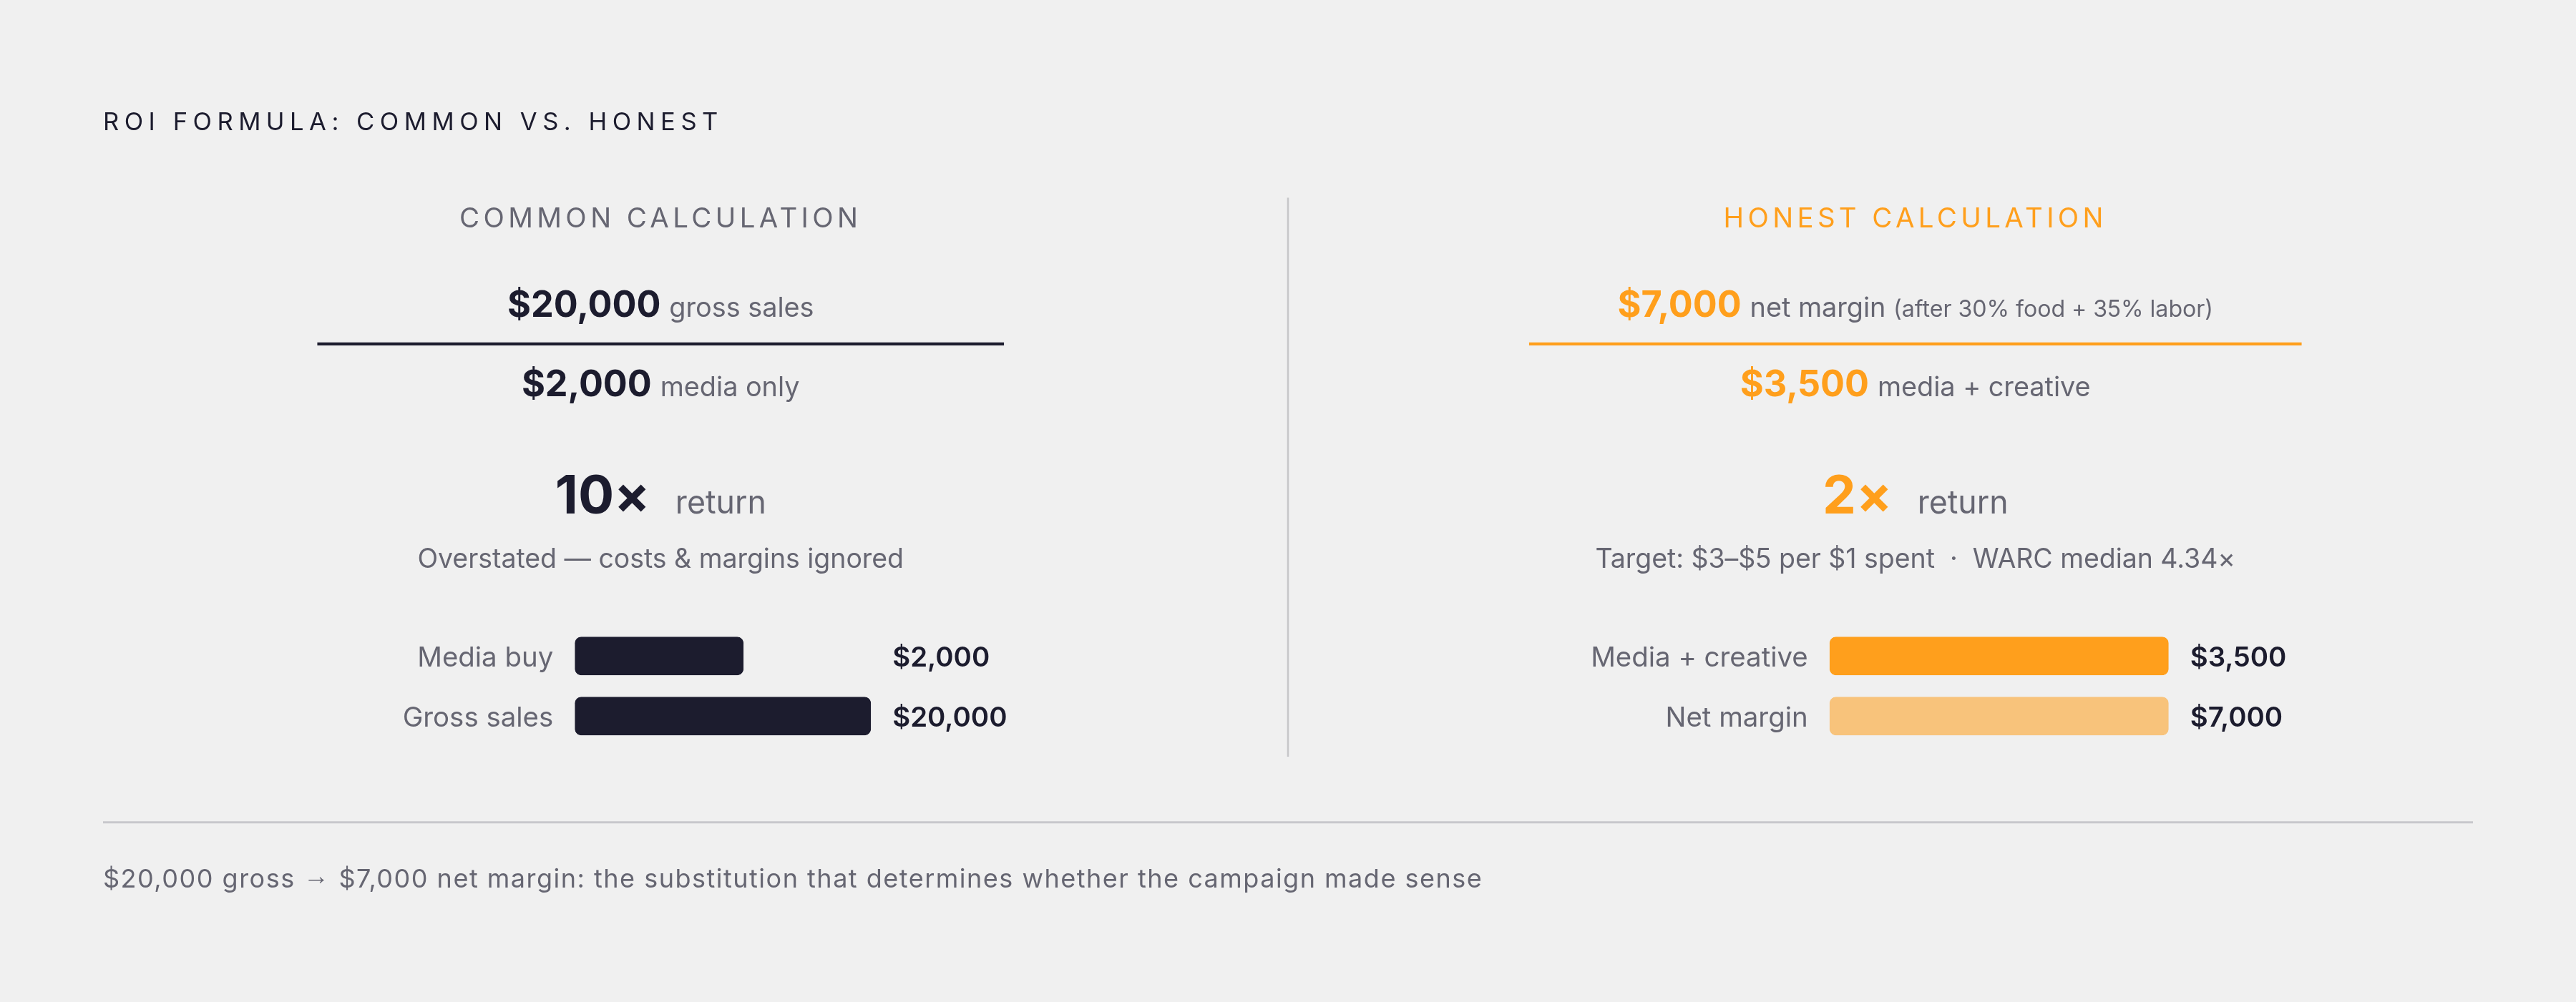
But even operators who understand incrementality often undercount their costs. Ad spend, properly defined, includes creative production, agency or freelance fees, and platform costs, not just the media buy. Leaving those out inflates ROI in a way that feels good and means nothing. If a campaign generated $10,000 in attributed margin and the media buy was $2,000 but the creative cost another $1,500, the denominator is $3,500, not $2,000. That distinction changes whether the campaign made sense.
On the revenue side, the figure that matters is net margin on incremental covers, not gross sales. Inventory, labor, and cost of goods come out first. A restaurant running 30% food cost and 35% labor is netting roughly 35 cents of every dollar of revenue; a campaign that "generated $20,000 in sales" generated about $7,000 in margin, which is the only number worth putting into the ROI formula.
WARC data puts top campaigns at a 4.34:1 median return. A working target range for most operators is $3 to $5 returned for every $1 spent, which translates to 300% to 500% ROI. Consider those a floor, not a ceiling. The reason the ceiling is higher for digital specifically is that digital channels allow performance to be tracked granularly enough that operators who measure correctly can identify which specific spend is underperforming and cut it, which is a lever that TV and print buyers have rarely had.
One caveat before moving into channels: campaign-level ROI is only useful once you've decided which metric each channel is responsible for. A paid search campaign and a TikTok influencer partnership should not be held to the same KPI. The channel sections below address that distinction directly.
Paid Search: The Channel Best Suited to Measuring Cost-Per-Cover Directly
Paid search is the most measurable channel in the restaurant marketer's toolkit, and the reason is structural. Intent is explicit. A user typing "dinner reservations downtown" has already done the motivational work; the ad doesn't need to create appetite, only to meet it. The path from click to booking is short, and Google conversion tracking can close the loop to an actual reservation click with a level of precision that most other channels can't approach.
The economics reinforce this. The restaurant industry's average cost-per-click on Google Search sits at $2.69, relatively modest for reaching a diner who is actively looking to book. Cost-per-lead for Restaurants and Food on Google Ads averages $29.67, one of the lowest figures across the 23 industries tracked in the benchmarking data, and well below the cross-industry average of $66.69. In 2024, Restaurants and Food saw a 72.16% increase in Google Ads conversion rates, the third-largest jump of any industry tracked, which signals that the channel is getting more efficient as operators get better at it.
How do you convert cost-per-lead into cost-per-cover? Divide the CPL by the reservation show-up rate, which typically runs between 80% and 90%. At $29.67 CPL and an 85% show-up rate, the actual cost per seated guest is roughly $35. Whether that makes sense depends on average check value and margin, which is why those figures need to be calculated before setting the paid search budget and acceptable cost-per-acquisition thresholds, not after.
Display ads deserve a separate conversation because they operate differently enough to require different expectations. Click-through rates hover below half a percent, conversion rates are lower still, and cost-per-conversion runs considerably higher than search. Display earns its place as a retargeting vehicle: reaching users who visited the site but didn't book is a reasonable use of that spend. It should not share a KPI with search because it is not doing the same job.
The campaigns that consistently justify their budgets are branded keyword bidding (protecting your own name against aggregator and competitor bidding), local intent queries, and retargeting visitors who navigated to the reservations page and left. Track reservation clicks, promo code redemptions, and, where POS integration exists, actual covers attributed to campaign traffic via UTM tags in Google Analytics 4. If you can close that loop to the transaction level, cost-per-cover becomes a real number rather than an estimate.
Social Ads on Meta and TikTok: Where Discovery Converts When the Creative Earns It
The fundamental difference between paid search and paid social is a matter of intent. On search, the diner is looking for a restaurant. On Meta or TikTok, the ad has to manufacture the craving. That is a harder job, and it requires holding the channel to a different standard.
Facebook's median click-through rate for Food, Beverage and Restaurants is 1.64%, with a cost-per-click of around $0.155, according to Two Minute Reports' 2025 benchmarking data. That is cost-efficient at the top of funnel. Whether it stays efficient depends entirely on what happens after the click, specifically, the conversion rate from click to reservation. Paid social for restaurants, when targeting is tight on local radius, demographic match, and lookalike audiences built from past guests, converts at 6% to 12% for reservations with CPCs that compete with search. When targeting is loose, the same spend produces impressions that feel like marketing and function like nothing.
Instagram's engagement rates for food content run higher on Reels and vertical video than on static posts, with Sprout Social's 2025 data suggesting vertical video earns up to double the engagement. Format choice is not a stylistic preference; it is a budget decision.
TikTok is where the discovery argument gets serious. The average engagement rate on the platform runs around 2.5%, and food and beverage content generates video views at a scale that is difficult to replicate on other platforms. Among Gen Z specifically, TikTok drives 38% of restaurant discovery according to Toast's 2026 discovery report, which surveyed over 1,400 U.S. adults in late 2025. That makes it among the most influential introduction channels for the youngest high-spending cohort. Short-form video adoption among restaurants rose from 26% in 2023 to 48% in 2024. Every operator I've spoken with who hasn't tested it is no longer an early-adopter holdout; they are behind the median.
That raises an important question: if discovery is happening on TikTok, where is conversion happening? The answer, largely, is somewhere else. According to TouchBistro's 2025 Diner Trends Report, 67% of Gen Z and 57% of Millennials use social platforms when deciding where to eat, and diners spend an average of 40 minutes researching restaurants on social before booking. The channel's job is often to win the research session, not to drive the immediate click. Last-click attribution will chronically undervalue social because the conversion often registers on a subsequent Google search or direct site visit, which is the core argument for view-through attribution on discovery channels.
The attribution tactic that bridges this gap without enterprise software: install the Meta Pixel on reservation confirmation pages, use UTM-tagged links throughout, and track cost-per-new-guest-acquired by matching reservation source data against campaign spend. CTR alone tells you almost nothing useful about whether the spend generated covers.
Influencer and Video Campaigns: Measuring Awareness Spend That Eventually Shows Up in Covers
Let's be honest about why influencer ROI measurement is uncomfortable: the causal chain from a food creator's post to a covered table runs through awareness, social proof, and frequently a search or a direct visit that happens weeks later. The connection exists. It is just not visible on a 30-day last-click report, which is why influencer campaigns get cut right before they would have proven themselves.
The benchmark that earns attention here is a substantial return per dollar spent on Instagram influencer campaigns in the food and beverage category, with engagement rates running roughly five times the average for in-house content. Micro-influencers, defined as creators with audiences between 10,000 and 100,000 followers, outperform macro creators on a cost-per-engagement basis for independent and regional operators. The reason is specificity: a food creator whose audience is concentrated in a specific metro will drive more covers per post than one with national reach spread too thin to matter at the local level.
YouTube's cost-per-view economics are more defensible for a new location launch or a seasonal menu push, where the extended format supports storytelling that a 15-second TikTok cannot. But expecting YouTube campaigns to consistently move weekly cover counts is optimistic to the point of being unrealistic.
How do you close the attribution loop on influencer spend? Three tools: unique promo codes per creator, dedicated landing pages with UTM tracking, and a post-campaign comparison of reservation volume in the creator's geographic market during and after the campaign window. None of those require enterprise software. All of them produce defensible data.
What this channel should not be held to is a cost-per-cover KPI on a 30-day window. That framing will make influencer spend look inefficient in most cases, because the attribution window is too short. A 60 to 90-day window is more honest, and a cost-per-new-guest-introduction metric is more appropriate than cost-per-cover. Those are not softer metrics; they are more accurate ones.
Email Marketing: The Highest-ROI Channel Operators Most Consistently Underuse
Email delivers $36 for every dollar spent on average, according to Statista. Sending between five and eight emails per month can push that figure to $48 per dollar, per EmailTooltester's research. No other channel in this framework comes close at scale. And yet, every independent and regional restaurant group I've encountered with an underutilized email list is sitting on their single highest-returning channel, or worse, hasn't built the list at all.
Fifty-five percent of consumers prefer email as their top channel for marketing communications from businesses, according to Constant Contact's 2025 data. Preference is not a soft metric for email; it is a deliverability and open-rate driver. A channel the audience has opted into and wants to receive performs differently than one interrupting them.
The metric email owns is repeat-visit lift: measuring whether a guest who received a campaign returned within a defined window versus a control group who did not. A "We miss you" email sent to guests inactive for 60 days has been shown to reactivate 23% of lapsed diners. That is a number operators can test against their own list.
Measuring repeat-visit lift without enterprise software requires one integration: matching email open and click records against POS transaction history by guest email address. The delta between campaign-exposed and non-exposed guests over 30 days is the lift figure. It is not elegant, but it is honest.
Segmentation by recency, frequency, and average check, the core variables of RFM segmentation, produces the highest-converting triggered campaigns without requiring a sophisticated customer data platform. Those three variables alone separate guests who need a gentle nudge from guests who need a win-back offer from guests who should be treated as VIPs.
Consider the arithmetic: restaurant retention averages 55%, which is among the lowest of any tracked sector. Recovering one additional visit from 10% of a 2,000-person email list at a $40 average check produces $8,000 in attributable revenue at near-zero marginal cost. Email is not glamorous. It is also, with some consistency, the highest-returning line item in the digital budget.
Loyalty Programs: The Infrastructure That Makes Every Other Channel's ROI Measurable
Loyalty members visit more often, spend more per visit, and show considerably higher customer lifetime value (CLV) than non-members. Ninety percent of operators offering loyalty programs report positive ROI, with an average return of 4.8x, and 35% of marketers say their programs generate between 5 and 7 times more revenue than they cost, per 2024 industry data. Payback periods typically run 8 to 14 months.
The reason loyalty belongs in a measurement framework article rather than just a retention article is more specific: a loyalty ID tied to a POS transaction is the cleanest form of closed-loop attribution available to a restaurant operator. Campaign sent, guest returns, transaction recorded, revenue attributed, at the individual guest level rather than modeled in aggregate.
That attribution chain enables something powerful upstream. Operators who have built this loop can assign actual revenue to the email that triggered the return visit, to the paid search click that acquired the guest originally, and to the influencer post that first introduced the brand. Every upstream channel's ROI calculation becomes more defensible because the revenue endpoint is real, not estimated.
Without a loyalty layer, attribution on retention campaigns is estimated. With it, attribution is transactional. That is not a subtle distinction.
Fifty-two percent of consumers already participate in restaurant loyalty programs, per the National Restaurant Association's 2024 data, and 76% of limited-service restaurants saw a traffic increase in 2024 attributed to their loyalty program. Sixty-one percent of operators now offer programs, with nearly half planning to update or enhance them. Operators building loyalty infrastructure now are closing a gap; operators ignoring it are widening one.
Online Reviews as a Measurable Revenue Input, Not Just a Reputation Concern
Most operators treat review management as a brand hygiene function, something the front-of-house manager handles when a bad one comes in. That framing undervalues what the data shows reviews actually do to revenue.
Harvard Business School research by Michael Luca found that a one-star increase in Yelp rating leads to a 5 to 9% revenue increase for independent restaurants. A separate Berkeley study found that a half-star improvement on Yelp makes a restaurant 30 to 49% more likely to be fully booked during peak hours. These are not marginal effects. They are the kind of revenue impacts that would justify significant paid media spend if they came from an ad platform.
A large majority of consumers read reviews before choosing a local business, according to BrightLocal's 2024 data, and 33% of U.S. customers would not eat at a restaurant with fewer than four stars. A restaurant sitting at 3.7 stars is not just underperforming; it is actively blocking the funnel.
Review signals contribute a meaningful share to local pack rankings according to Whitespark's 2023 Local Ranking Factors Report. That makes review volume and recency a paid search complement: stronger reviews improve organic visibility and reduce the paid CPC required to maintain top-of-page placement. Review management and paid search budgets are not separate conversations.
As of July 2025, Instagram content is indexed by Google, meaning strong social engagement on location-tagged posts feeds both trust signals and search visibility simultaneously. The channels are converging in ways that make siloed measurement increasingly inaccurate.
The operator's action is straightforward: a systematic post-visit review request via SMS or email within 24 hours converts satisfied guests into review volume at near-zero cost. Track average star rating, review velocity, and response rate as KPIs alongside paid channel metrics. Model the revenue impact of a half-star improvement against current covers and average check. The ROI on the process is high relative to most paid alternatives.
Building a Full-Funnel Measurement System From the Tools Most Operators Already Have
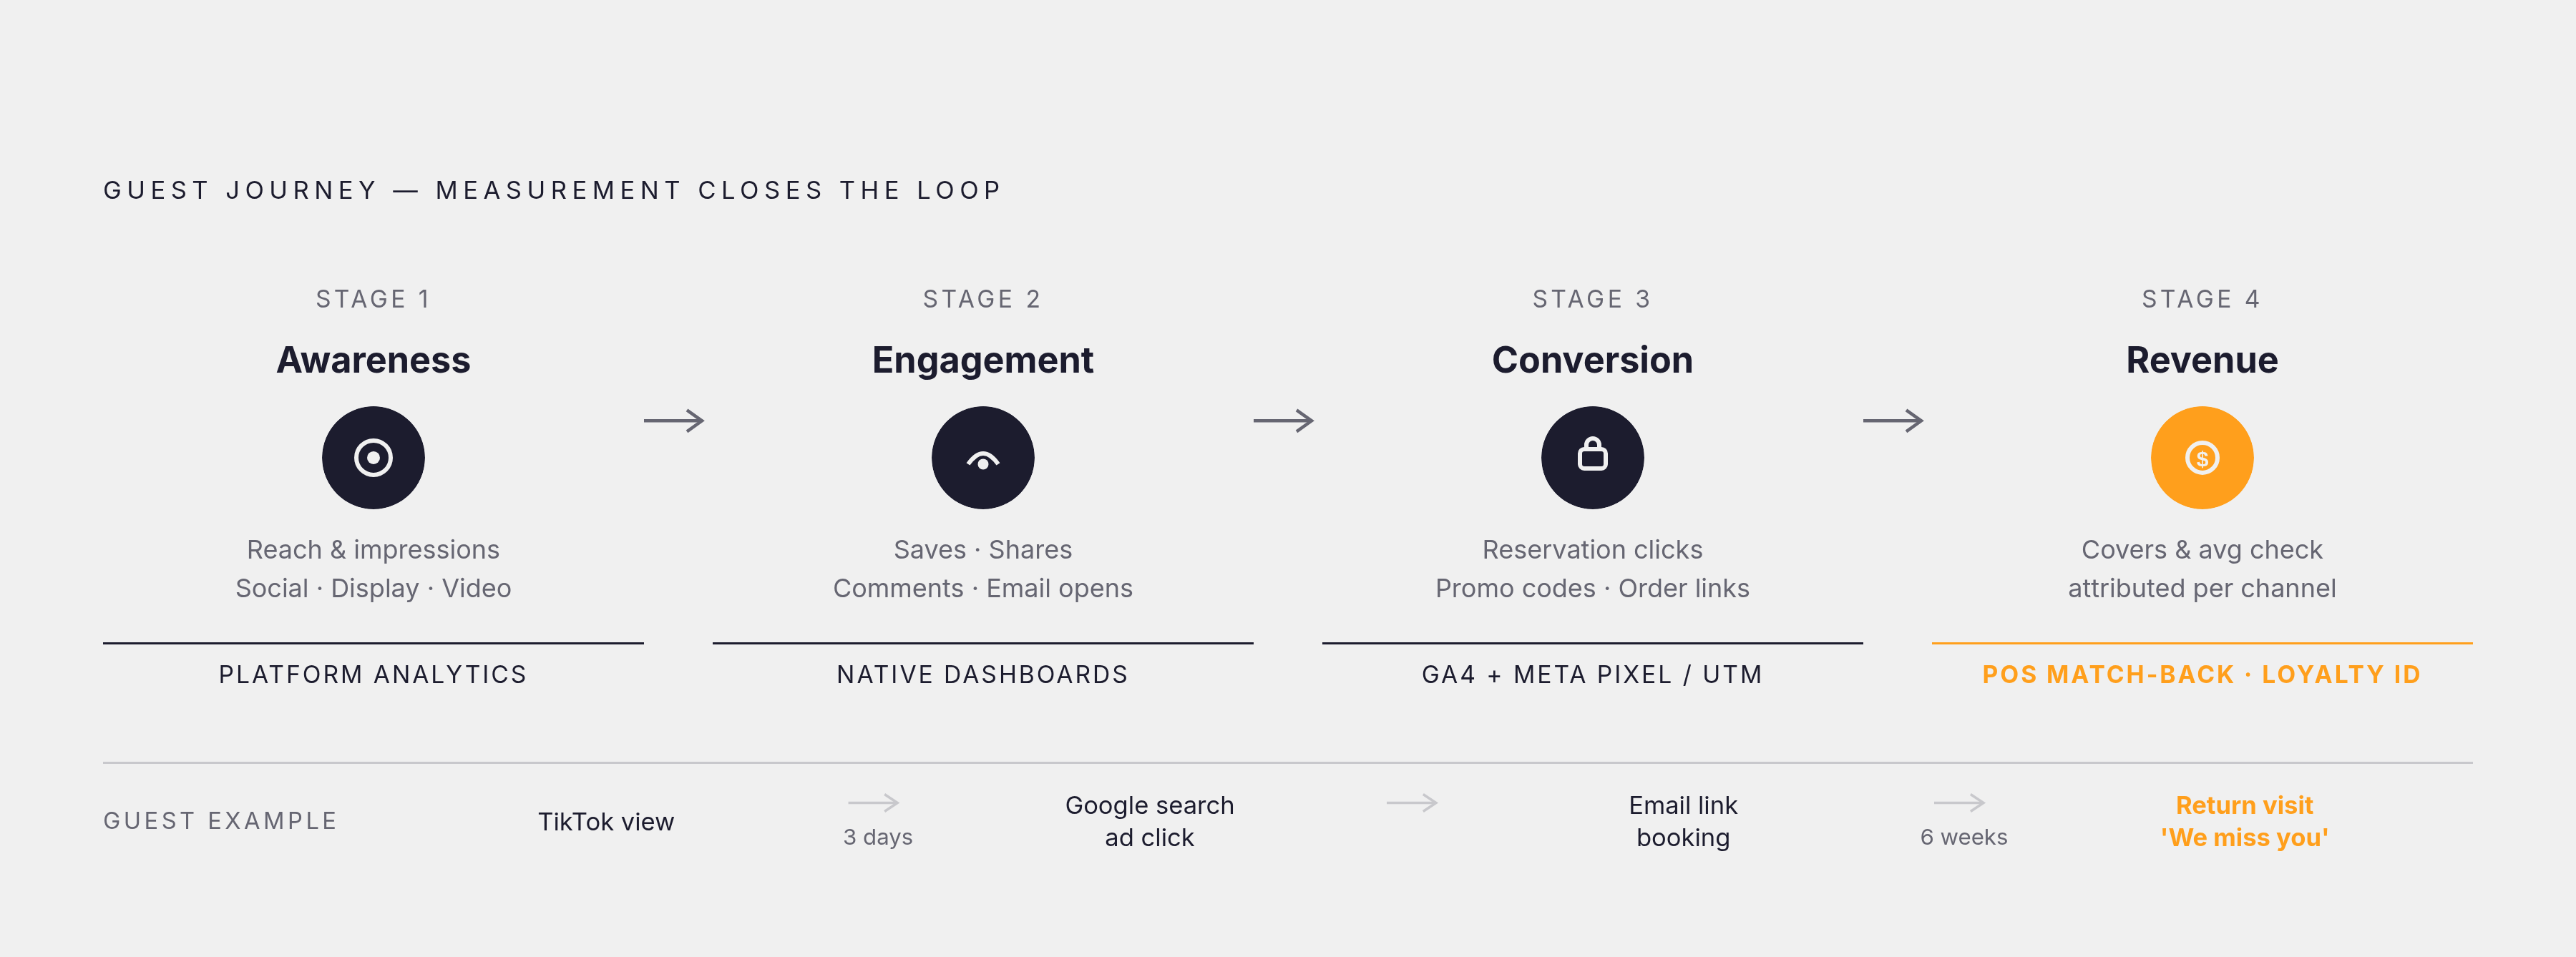
The guest journey does not move in a straight line. A diner sees a TikTok, searches Google three days later, gets a reservation confirmation, and comes back six weeks after a "We miss you" email. Attributing that cover entirely to email because it was the last touch before the visit is like crediting the maitre d' for cooking the meal, and it is precisely what last-click models do instead of multi-touch attribution.
A full-funnel view requires four metric categories that map to the guest journey: awareness, measured by reach and impressions from social, display, and video; engagement, measured by saves, shares, comments, and email opens; conversion, measured by reservation clicks, order link visits, and promo code redemptions; and revenue, measured by attributed covers and average check through POS match-back or loyalty ID.
The practical attribution stack, assembled from tools most operators already have, looks like this. The Meta Pixel on reservation confirmation pages closes the loop between social ad impression and booking. UTM-tagged links on all email and social posts feeding into Google Analytics 4 track the source of reservation page visits. Host stand source tracking, asking guests how they heard about the restaurant, captures walk-in discovery that digital tools miss entirely. POS match-back against guest emails ties transactions to campaign-exposed guests and enables repeat-visit lift calculation.
None of those require enterprise software. They require discipline.
Multi-touch attribution, even in its simplest form, is more honest than last-click. A guest who sees a TikTok, clicks a Google search ad three days later, and books via an email link should not hand the entire conversion credit to email. A simple first-touch and last-touch split across channel categories already outperforms pure last-click in accuracy, and it requires no additional technology.
Guests who engage through digital channels show meaningfully higher lifetime value than those acquired through traditional channels alone. That figure justifies the investment in attribution infrastructure, because it reveals that the guests digital campaigns acquire are more valuable, not merely more numerous.
The fragmentation warning is real and worth naming explicitly. A POS system that doesn't communicate with the loyalty platform creates attribution gaps that no amount of clever tagging can fully close. Data-sharing between systems is not a nice-to-have configuration detail; it is the precondition for the entire measurement framework to function. Every operator I've watched evaluate a new POS, loyalty tool, or online ordering system who skipped asking whether it exports guest-level transaction data in a format their other systems can actually read has paid for that omission later.
The closed-loop benchmark to aim for is transaction-level attribution: a campaign action connected to a specific POS record. That is what separates the belief that campaigns work from the proof that they do. Most operators are currently operating on the belief. The infrastructure to get to proof is more accessible than they think, which is the problem Feastalytics, a restaurant analytics platform that unifies POS, delivery, and marketing data and ties campaign spend directly to in-store revenue, was built to solve.