Measuring ROI on Restaurant Digital Marketing Spend
Track attributed revenue, not total sales, to see if your digital spending actually drives profit.

Established restaurants typically allocate 3 to 6 percent of gross revenue to marketing. Growth-stage concepts run higher, often 5 to 10 percent, and launch phases push further still. Of that budget, the majority now flows to digital. Local food and restaurant advertising in the U.S. reached $14.1 billion in 2024, up more than 3 percent year-over-year. Seventy-three percent of operators increased technology investments that same year, the highest adoption rate the sector has recorded.
The practical implication is easy to underestimate. A restaurant doing $1.5 million annually, spending 3 percent on marketing, is committing more than $45,000 to that effort. Misallocate it and the margin hit is immediate and measurable. In a business running 4 percent net, there is no cushion to absorb a bad quarter of misdirected spend.
But here is the part operators rarely audit honestly: knowing the budget envelope is the easy step. Understanding what return to expect from it requires a baseline formula, and, more critically, a clear-eyed reckoning with what actually counts as return.
The Core ROI Formula and What Actually Counts as Attributed Revenue
The standard formula: ROI equals attributed revenue minus ad spend, divided by ad spend, multiplied by one hundred. Industry benchmarks suggest a 300 to 500 percent return is strong, with 500 percent cited widely as a success threshold. Below 200 percent generally signals a strategy problem.
The formula is not complicated. The inputs are where things go sideways.
The critical distinction is between total revenue and attributed revenue. Only incremental revenue, the portion a specific campaign actually generated rather than revenue that would have arrived anyway, belongs in the numerator. And before calculating net profit, inventory costs, labor, and the full cost of the marketing effort, not just the media buy, must come out.
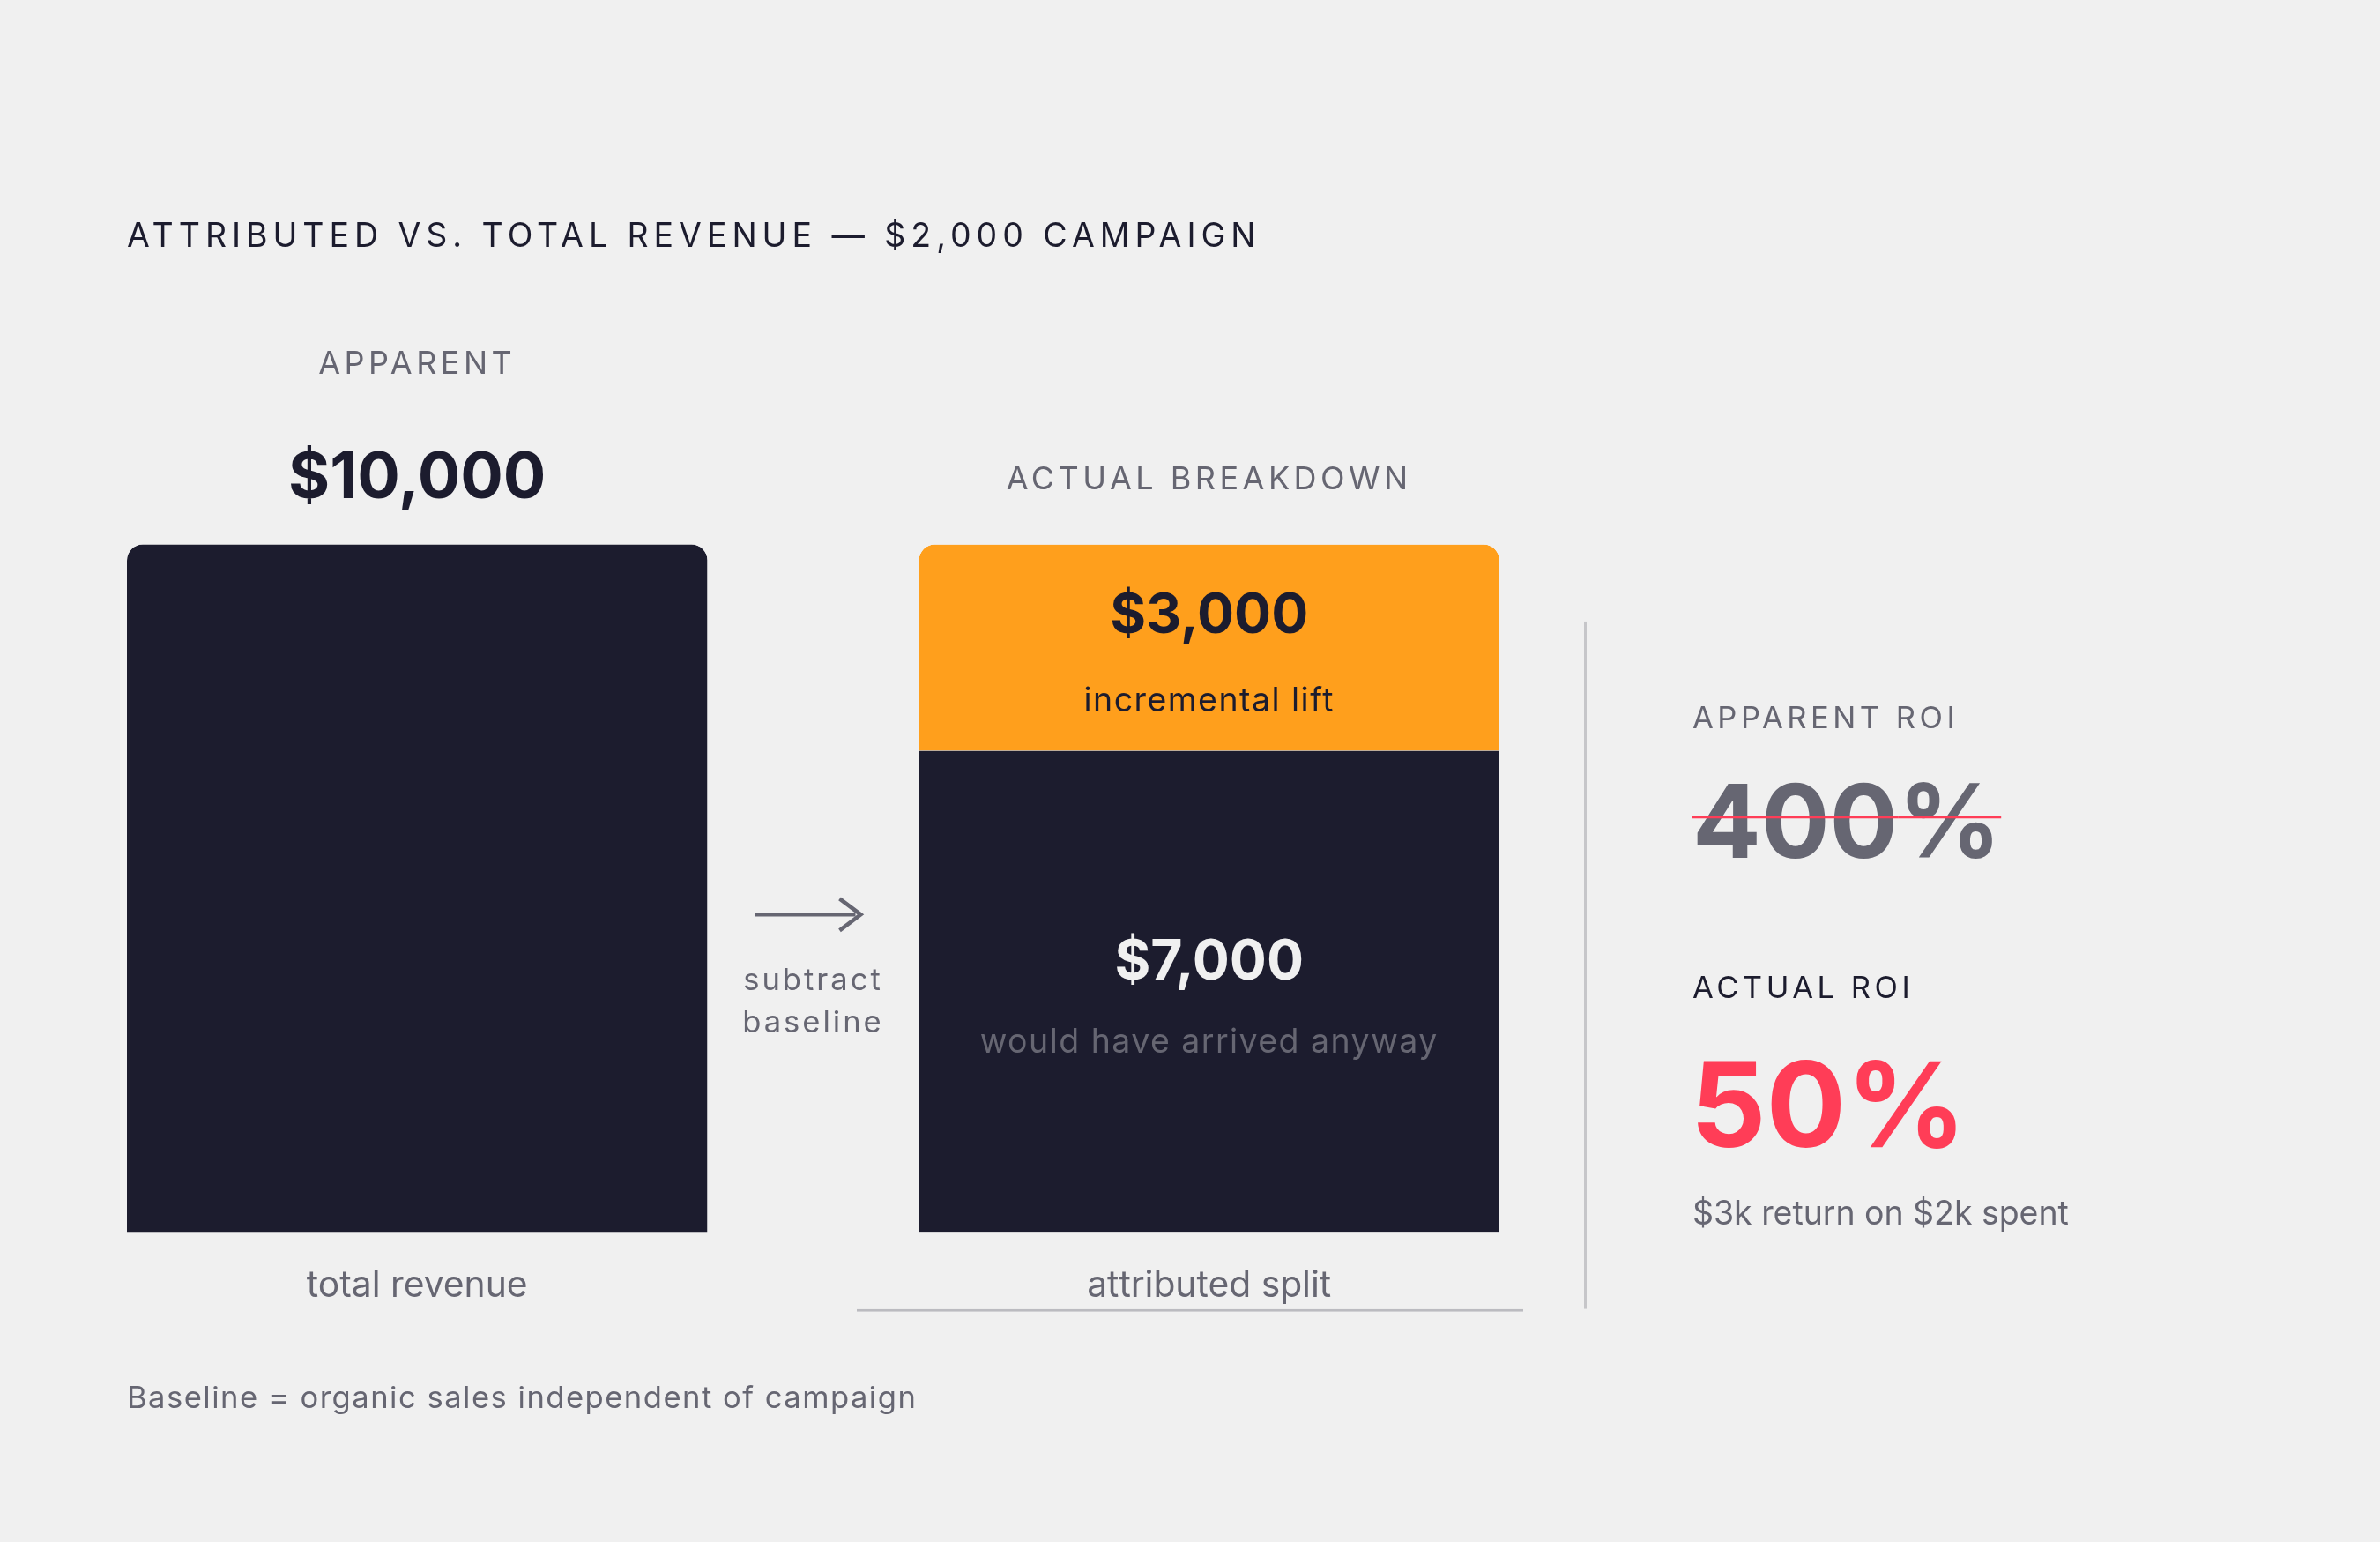
Consider what this looks like in practice. A campaign costs $2,000 and appears to generate $10,000 in sales during the promotion window. If $7,000 of that revenue would have come in regardless, the actual attributed revenue is $3,000. The real ROI is 50 percent, not 400. Counting all revenue that coincides with a promotion as campaign revenue, rather than applying incrementality testing to isolate the lift, is the most pervasive error in restaurant marketing measurement. It is also how operators spend years convincing themselves a strategy is working while the economics quietly deteriorate beneath them.
That single distinction, total versus incremental, is where most restaurant ROI calculations collapse. Get it wrong and every channel analysis downstream is built on a fiction — like a soufflé that looks perfect until you realize no one turned on the oven.
Customer Acquisition Cost: The Metric That Reveals Whether Growth Is Actually Profitable
Average restaurant customer acquisition cost ranges from $30 to $80 depending on concept type, and that range climbed materially between 2023 and 2025. Privacy rule changes, intensifying platform competition, and rising marketing labor costs all contributed. iOS 14.5 degraded paid ad targeting precision in ways the industry is still absorbing. Average cost-per-click on major platforms rose in parallel. The environment got more expensive and more opaque simultaneously.
The practical rule: CAC should not exceed 5 to 10 percent of average first-year customer revenue, and the CLV-to-CAC ratio should be at least three to one. If average CLV is $300, a target CAC of $100 or less is defensible. Above that, growth is destroying margin rather than building it. The restaurant is, in effect, paying more to acquire customers than those customers will ever return.
Why does this matter before you evaluate any specific channel? Because a channel with an attractive cost-per-click can still produce a ruinous CAC if conversion rates are low or retention does not follow. A click is an event. An acquisition is an outcome. The gap between those two things is where a great deal of marketing budget quietly disappears.
CAC is the entry cost. What the customer does afterward determines whether that entry was worth paying.
Repeat Visit Rate and Lifetime Value: The Metrics That Separate One-Time Spend from Durable Revenue
Retaining an existing customer costs meaningfully less than acquiring a new one. In a thin-margin business, that asymmetry is not a motivational platitude; it is a structural argument for where limited attention should actually go.
Loyalty program data makes the case concretely. Members visit more frequently and spend more per visit than non-members. Customers enrolled in loyalty programs show substantially higher lifetime value. Ninety percent of operators offering loyalty programs report positive ROI, averaging a 4.8 times return, with nearly 35 percent of marketers reporting returns in the 5 to 7 times range. Payback periods on loyalty technology typically run 8 to 14 months.
The metric to anchor this to is repeat visit rate: the share of customers who return within a defined window, typically 30, 60, or 90 days. It measures whether marketing is building something durable or merely cycling traffic through once and hoping for the best.
One concrete signal worth sitting with: a "We miss you" email to guests inactive for 60 days reactivated 23 percent of lapsed diners. That is a measurable retention outcome tied to a specific action, the kind of number that belongs in a channel ROI calculation rather than a general sense that "email is working."
CLV and repeat visit rate should sit alongside CAC in every channel evaluation. A channel that drives cheap first visits but generates no return behavior has poor true ROI regardless of how the acquisition cost looks in isolation. It is growth that dissolves on contact — all sizzle, no second course.
How Email and Loyalty Programs Produce the Most Traceable ROI of Any Digital Channel
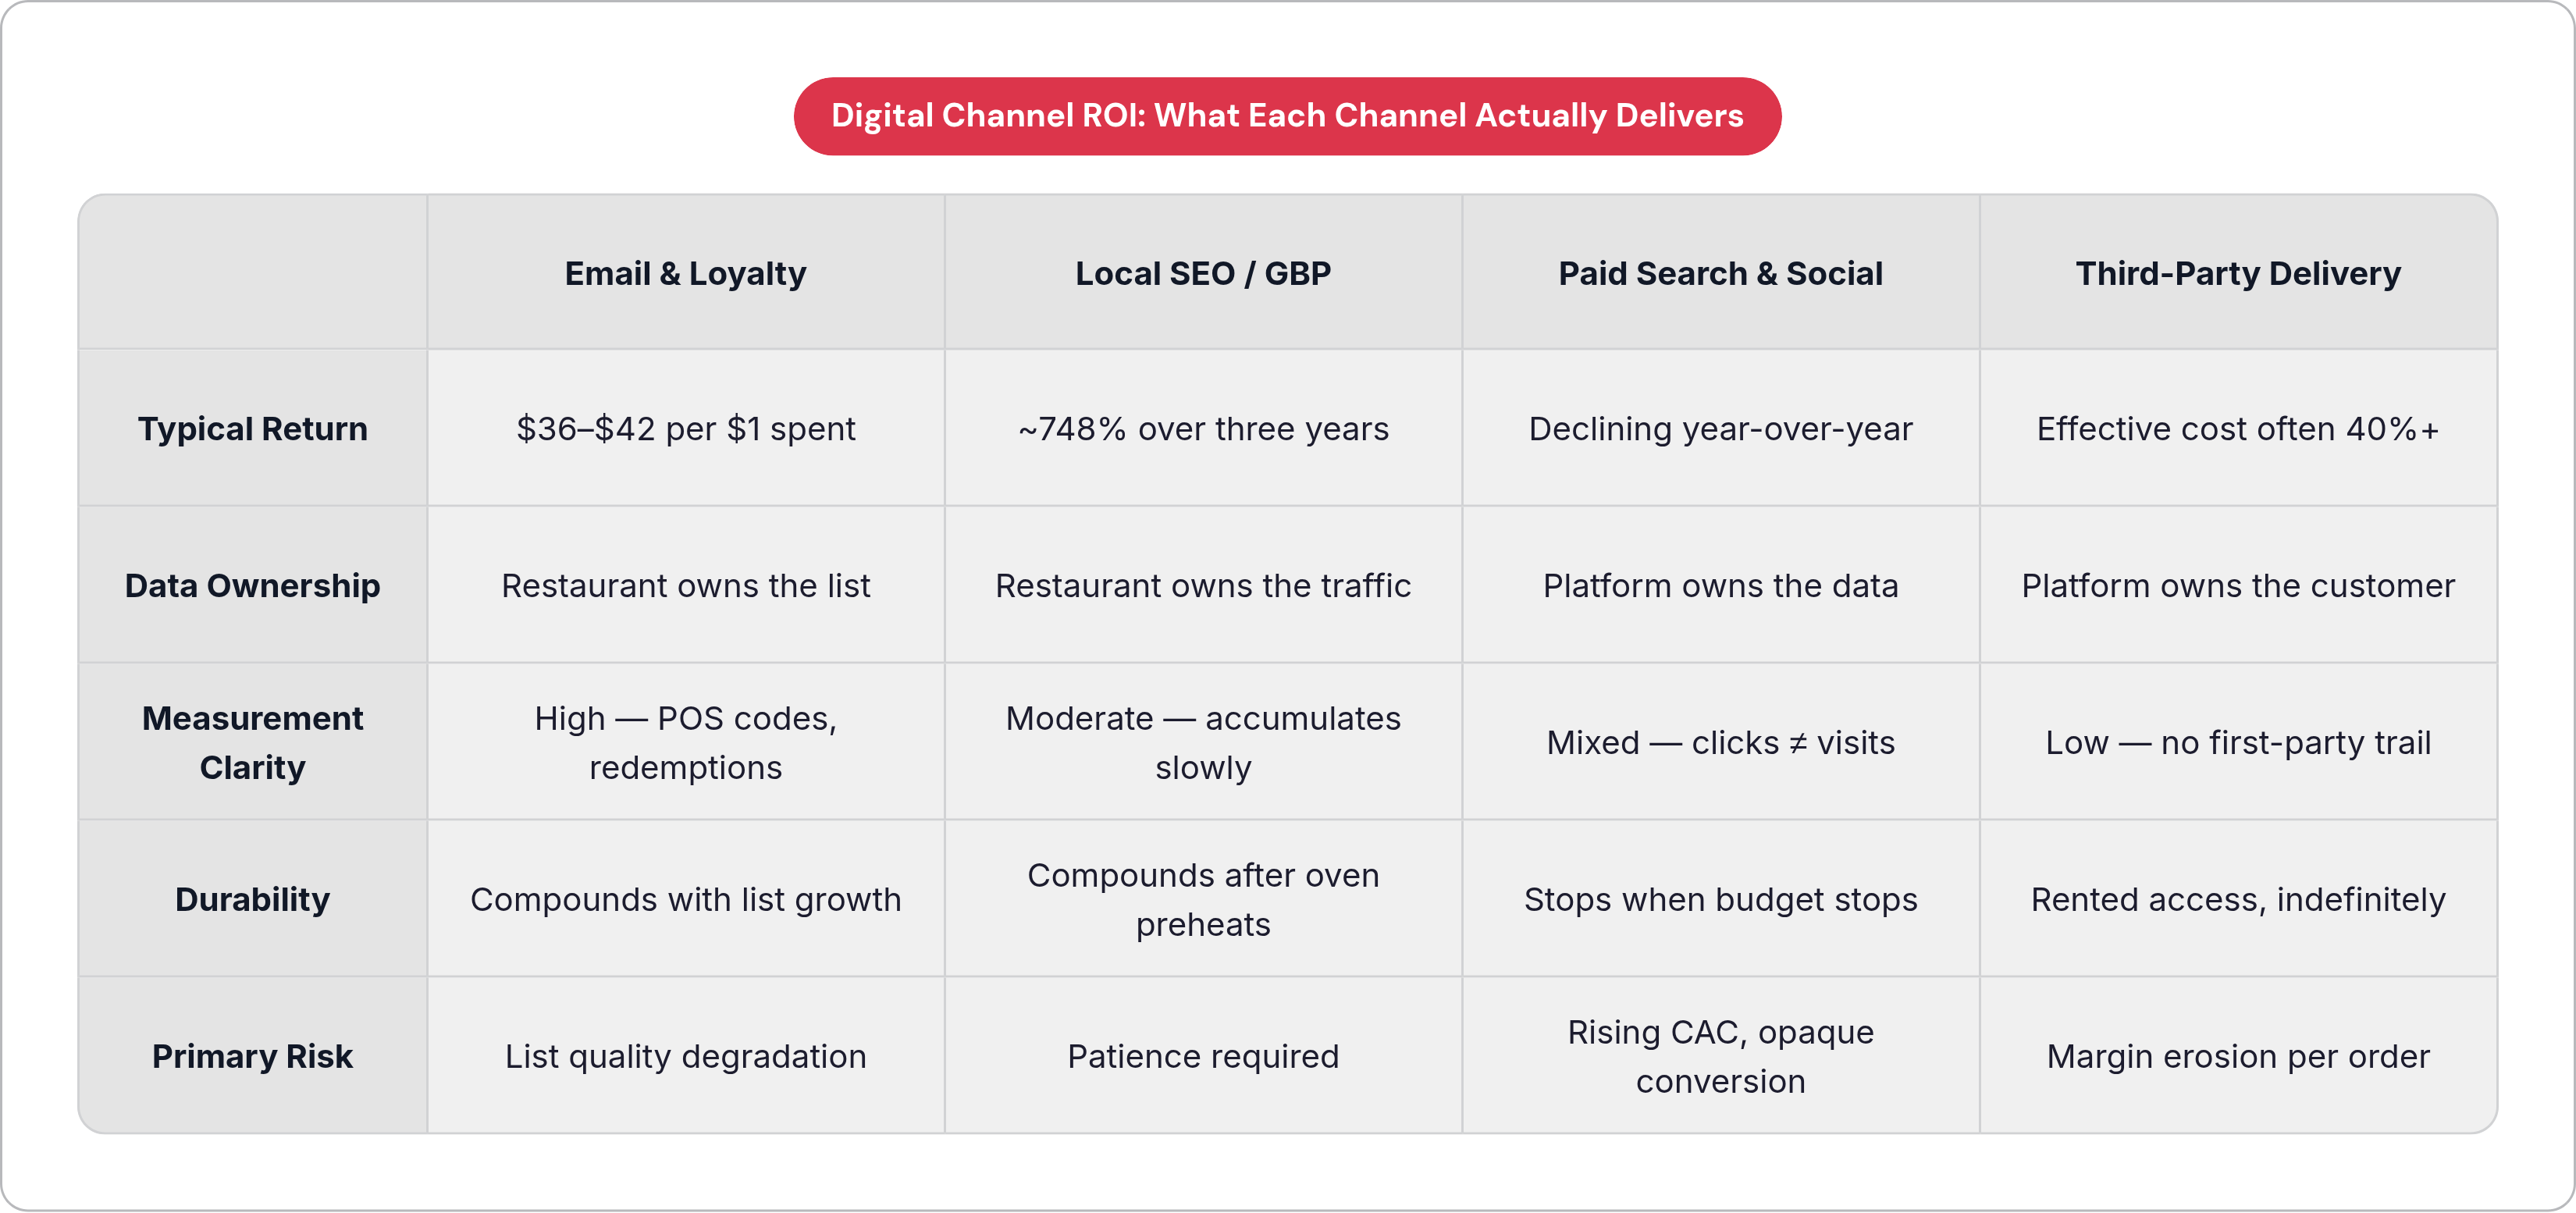
Email's return-on-investment advantage is well-documented: restaurant-specific figures cluster in the $36 to $42 return per dollar spent range. Frequency matters as much as content; research on email cadence shows that higher-volume sending correlates with stronger average returns, provided the list is healthy and the content earns the open. Restaurant email benchmarks in 2025 show open rates between 18 and 20 percent, click-through rates around 2 percent, and click-to-open rates near 10 percent.
What makes email uniquely traceable is ownership. The restaurant owns the list, controls the timing, and can tie redemptions to campaign sends through POS codes, reservation links, or unique promotional identifiers. Loyalty programs extend this further. Every transaction by a loyalty member generates a first-party data trail, visit frequency, average check, recency, that can be mapped to specific marketing triggers. Fifty-two percent of consumers already participate in restaurant loyalty programs, a figure that has been rising. Seventy-six percent of limited-service restaurants saw traffic increase in 2024 driven at least partly by loyalty activity.
It is also worth considering what distinguishes email and loyalty from organic social: the data belongs to the restaurant. Instagram follower data belongs to Instagram. Order history on DoorDash belongs to DoorDash. That distinction compounds over time, because first-party data reduces future acquisition costs in ways platform-owned data structurally cannot.
Paid channels offer reach that email and loyalty cannot match. But the measurement is messier, and the returns are harder to defend.
Paid Search and Social Ads: What the Cost-Per-Click Numbers Actually Tell You, and What They Hide
Google Ads benchmarks for restaurants show average cost-per-click in the low single digits for local campaigns, with conversion rates typically between 5 and 8 percent. A well-executed Google Performance Max campaign, in one documented case, drove nearly 400 new visits at roughly $2.55 per visit, which is a useful frame because it measures visits rather than impressions. That framing distinction matters more than it sounds.
Facebook and Instagram CPC for restaurant campaigns runs lower, often under a dollar, with conversion rates to reservations or orders ranging from 6 to 12 percent. But both Meta Ads and Google Ads recorded negative ROI trends for the second consecutive year in a recent analysis of digital marketing performance, declining meaningfully year-over-year. That is not a categorical condemnation of paid media. It is a signal that costs are rising faster than returns in the current environment, and that operators still running the same paid campaigns they ran in 2021 should be uncomfortable.
Why does CPC alone mislead? A low cost-per-click on social can still produce a catastrophic CAC if the audience does not convert to in-restaurant behavior. Click volume is an easy number to put in a report. It is also largely useless in isolation. Click-to-reservation, click-to-order, and cost per new customer are the figures that connect to actual revenue and can be cross-referenced against POS data. Impressions and reach feel like evidence of impact. They are not.
Organic social has grown harder in parallel: algorithms have cut organic reach substantially for restaurant accounts, even as platforms like TikTok demonstrably influence where people choose to eat. Converting that influence into measurable revenue requires a trackable path, a booking link, a promo code, an online order. Without that path, influence is not revenue. It is a good feeling.
Local SEO and Google Business Profile: The Channel With the Highest Long-Term ROI That Most Operators Underinvest In
More than 90 percent of restaurant discovery happens via search engines and map apps. Nearly half of restaurant website traffic originates from local searches. Those two numbers alone should settle the question of where foundational investment belongs.
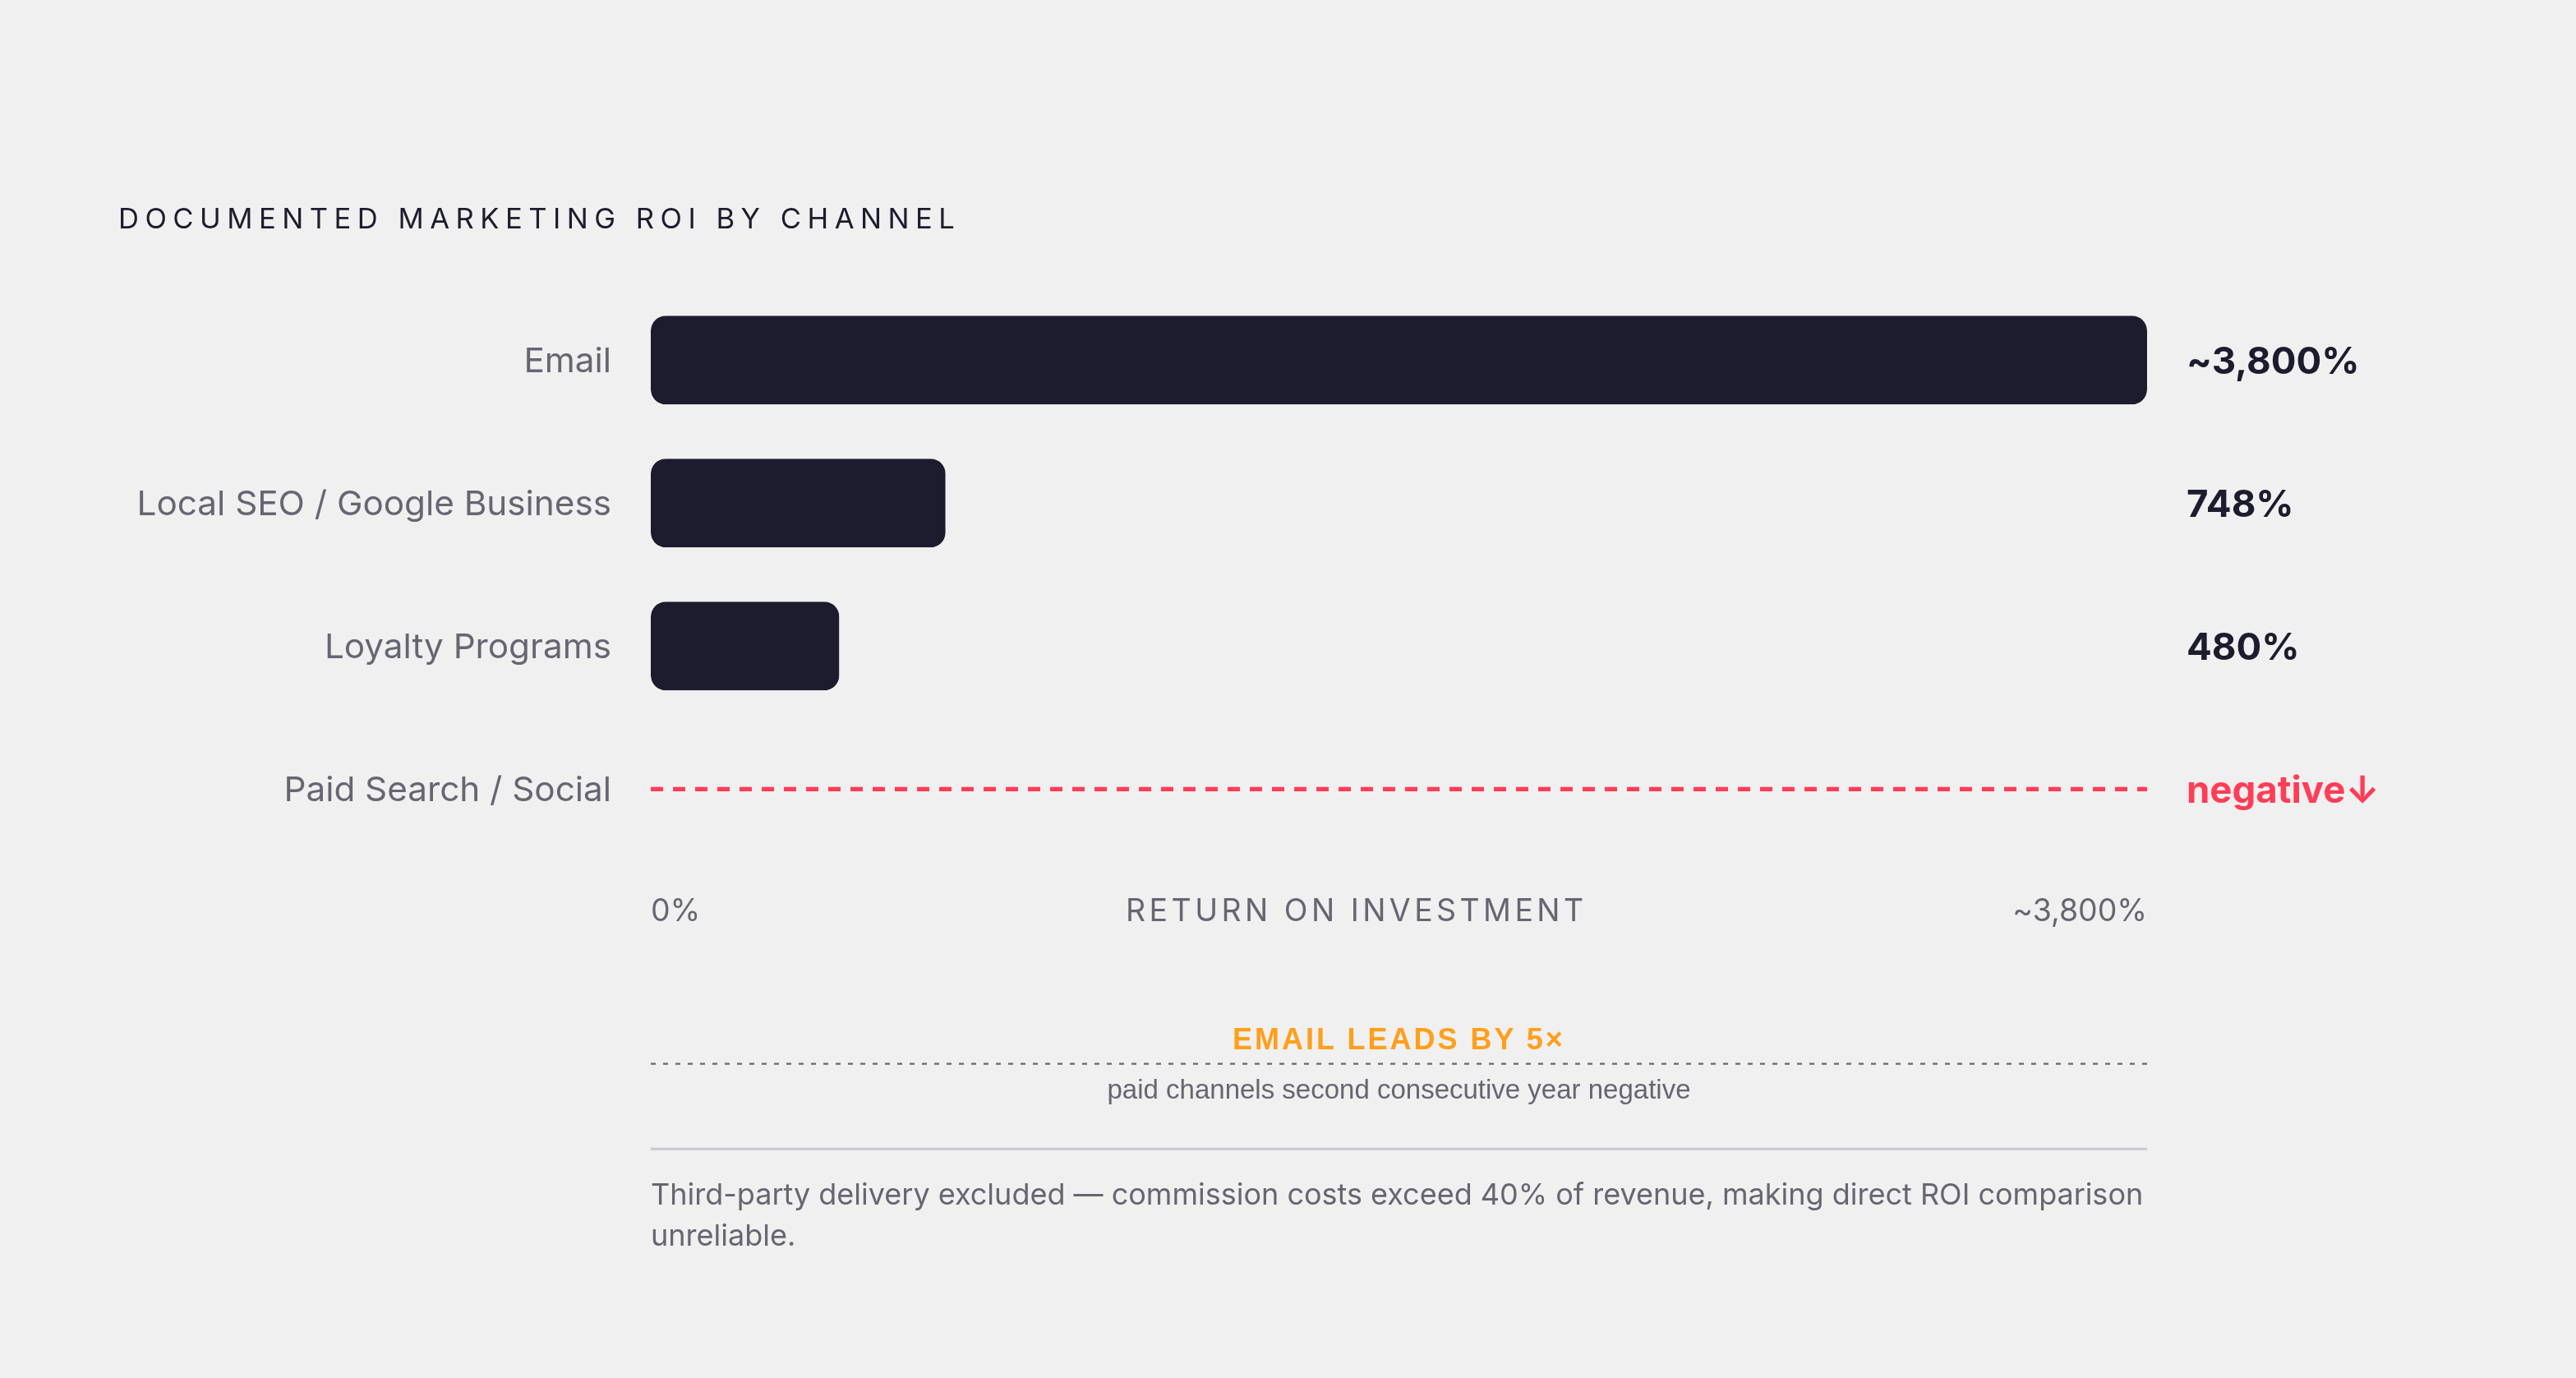
A 2026 analysis of more than 3,400 campaigns representing $127 million in combined ad spend found that SEO delivers a 748 percent average three-year ROI, substantially better than paid search and better still against paid social. But why exactly does this gap exist? It exists because SEO compounds in a way paid campaigns cannot. A paid ad stops performing the moment the budget stops. An optimized Google Business Profile listing keeps generating direction requests and clicks whether or not anyone is actively running a campaign that week.
The behavioral signals are specific enough to be actionable. Restaurants investing in Google Business Profile optimization, including weekly updates and category accuracy, gain several times more direction requests than those that do not. Restaurants using online ordering links on their GBP listing see meaningfully more orders. Review signals now contribute substantially to local pack rankings in Google Maps and organic search, and responding to at least a quarter of reviews correlates with significantly higher average revenue. Yet only a small fraction of businesses actually respond to reviews at all. That gap, between what the data clearly recommends and what most operators actually do, is a gift to whoever is willing to do the obvious thing.
The measurement challenge is real. Unlike a paid campaign with a defined start and end, SEO ROI accumulates over months. Operators need to track direction requests, organic search traffic, and order or reservation volume attributed to search as leading indicators, and they need patience with what they are measuring. That patience is part of why the channel stays underinvested. It does not produce the instantaneous feedback loop a paid campaign does. It produces something more durable, which, in a thin-margin business, is the more valuable thing.
Third-Party Delivery Platforms: Where the Revenue Looks Real but the Economics Often Aren't
Commission rates on major delivery platforms run nominally between 15 and 30 percent, but the actual cost of revenue can exceed 40 percent once menu adjustments, packaging costs, and the structural loss of customer data are factored in. Third-party delivery is, in economic terms, a paid acquisition channel with a per-order fee attached. Unlike Google Ads or email, it produces no first-party data the restaurant can use to reduce future acquisition costs.
That is the structural problem, and it is persistent. The customer relationship belongs to the platform. Order history, contact information, and repeat purchase behavior are platform-owned assets. Every customer acquired through a delivery app must be re-acquired at cost if the restaurant ever wants to move them to a direct channel. The restaurant is not building an audience; it is renting access to one, indefinitely.
Delivery platforms do provide genuine incremental revenue in some cases, reach that certain concepts cannot access otherwise. But the ROI calculation requires comparing contribution margin per delivery order, after commission and packaging, against contribution margin per dine-in cover or direct online order. The gap between those figures usually tells the story clearly enough that extended analysis is redundant.
There is also the cannibalization question worth asking: some delivery orders displace in-restaurant visits rather than adding net revenue. If a regular guest who would have come in on a Thursday night orders delivery instead, the restaurant has captured a lower-margin version of a transaction it would have had anyway. Whether that is common or rare depends on the concept. But operators who do not ask the question are not doing the calculation.
Why Attribution Breaks Down Across Fragmented Restaurant Systems, and What to Do About It
Paid media data lives in ad platforms. Reservation data lives in a booking system. POS data lives somewhere else. Loyalty, email, WiFi analytics, and coupon redemption rarely share a common customer identifier. Multi-touch attribution, mapping how different channels contribute to a single customer's journey, is structurally difficult in ways that a software integration alone cannot resolve.
Here is what that looks like in practice. A diner sees a TikTok video, checks Google reviews, receives an email with a promotion, and then walks in. Last-click attribution, the default model in most ad platforms, credits the email. The TikTok video, the search behavior, and the review engagement are invisible in the accounting. The restaurant concludes email is its best channel, doubles down on it, and systematically underinvests in the discovery channels that initiated the relationship in the first place. The measurement error becomes an allocation error. And the allocation error compounds quietly over time.
That raises an important question: is accurate attribution even achievable, or are we negotiating with an unsolvable problem? The answer sits somewhere in between. Connecting impressions and clicks from digital channels to actual reservations and revenue remains difficult for most operators, but the solution is not a perfect attribution model. It is a more disciplined approximation. The operators running three or four locations in competitive metro markets who outperform on ROI are not necessarily those with the most sophisticated technology stack. They are the ones tracking CAC, CLV, average order value, visit frequency, and channel contribution together rather than in isolation, and maintaining the discipline to update their assumptions when the data changes.
The default measurement most operators rely on, revenue during a campaign period minus ad spend, is almost certainly wrong. Building toward something better requires connecting systems that were not designed to talk to each other, accepting that the picture will always be somewhat incomplete, and treating the most reliable signals, email redemption rates, loyalty visit frequency, organic search volume, repeat visit rate, as the foundation. Feastalytics, a restaurant analytics platform that unifies POS, delivery, and marketing data and ties each campaign directly to in-store revenue, is one tool operators use to close that gap. Not the afterthought.
None of that is the glamorous part of running a restaurant. But it is the part that separates operators who actually understand what their marketing is doing from those who are, in good faith, simply spending money and hoping the trend lines cooperate.