QR Code Menus and Digital Ordering Technology
QR menus have evolved from pandemic necessity into a genuine operational lever for restaurants.
QR menus stopped being a pandemic workaround a while ago. What they've turned into is a genuine lever on table turn times, average check size, and, maybe more importantly, the volume of data a restaurant collects from every single guest interaction, whether the operator is looking at it or not.
Ask anyone who runs a restaurant why they haven't touched a QR menu since the pandemic first pushed them into fashion and the answer is usually some version of." Fair question. Except the numbers say otherwise: per Supercode's roundup, 75% of restaurants worldwide now use QR codes for digital menus, and DineOpen puts adoption growth at 340% since the pandemic years. That's not a fad limping along on inertia. That's a category that outgrew the crisis that birthed it, the way seltzer outgrew the low-carb diet fad that made it trendy.
The consumer side backs this up too. Eater's survey data, cited via MenuTiger, found 78% of respondents actually prefer QR menus to paper ones. And Supercode's 2026 numbers show 59% of smartphone users scan a QR code daily, for anything, not just menus. So the behavior isn't a leftover habit from a scary spring in 2020. It calcified into an expectation. The National Restaurant Association's 2023 data, cited in Sunday App, found close to 40% of guests point to speed and convenience as the top reason they prefer digital ordering and contactless payment. People didn't revert to paper once it was "safe" again for the same reason nobody's going back to an old subscription model once they had access to an on-demand streaming service: the faster option won and stayed won.
So adoption numbers and consumer appetite both back up the trend. The harder question, and the one this piece actually spends its time on, is what an operator gets out of a QR system beyond looking current. Turn times, labor allocation, check size, and a pile of behavioral data that most restaurants collect but hardly anyone uses. That's the actual subject here.
What QR menu technology consists of, and how its components fit together
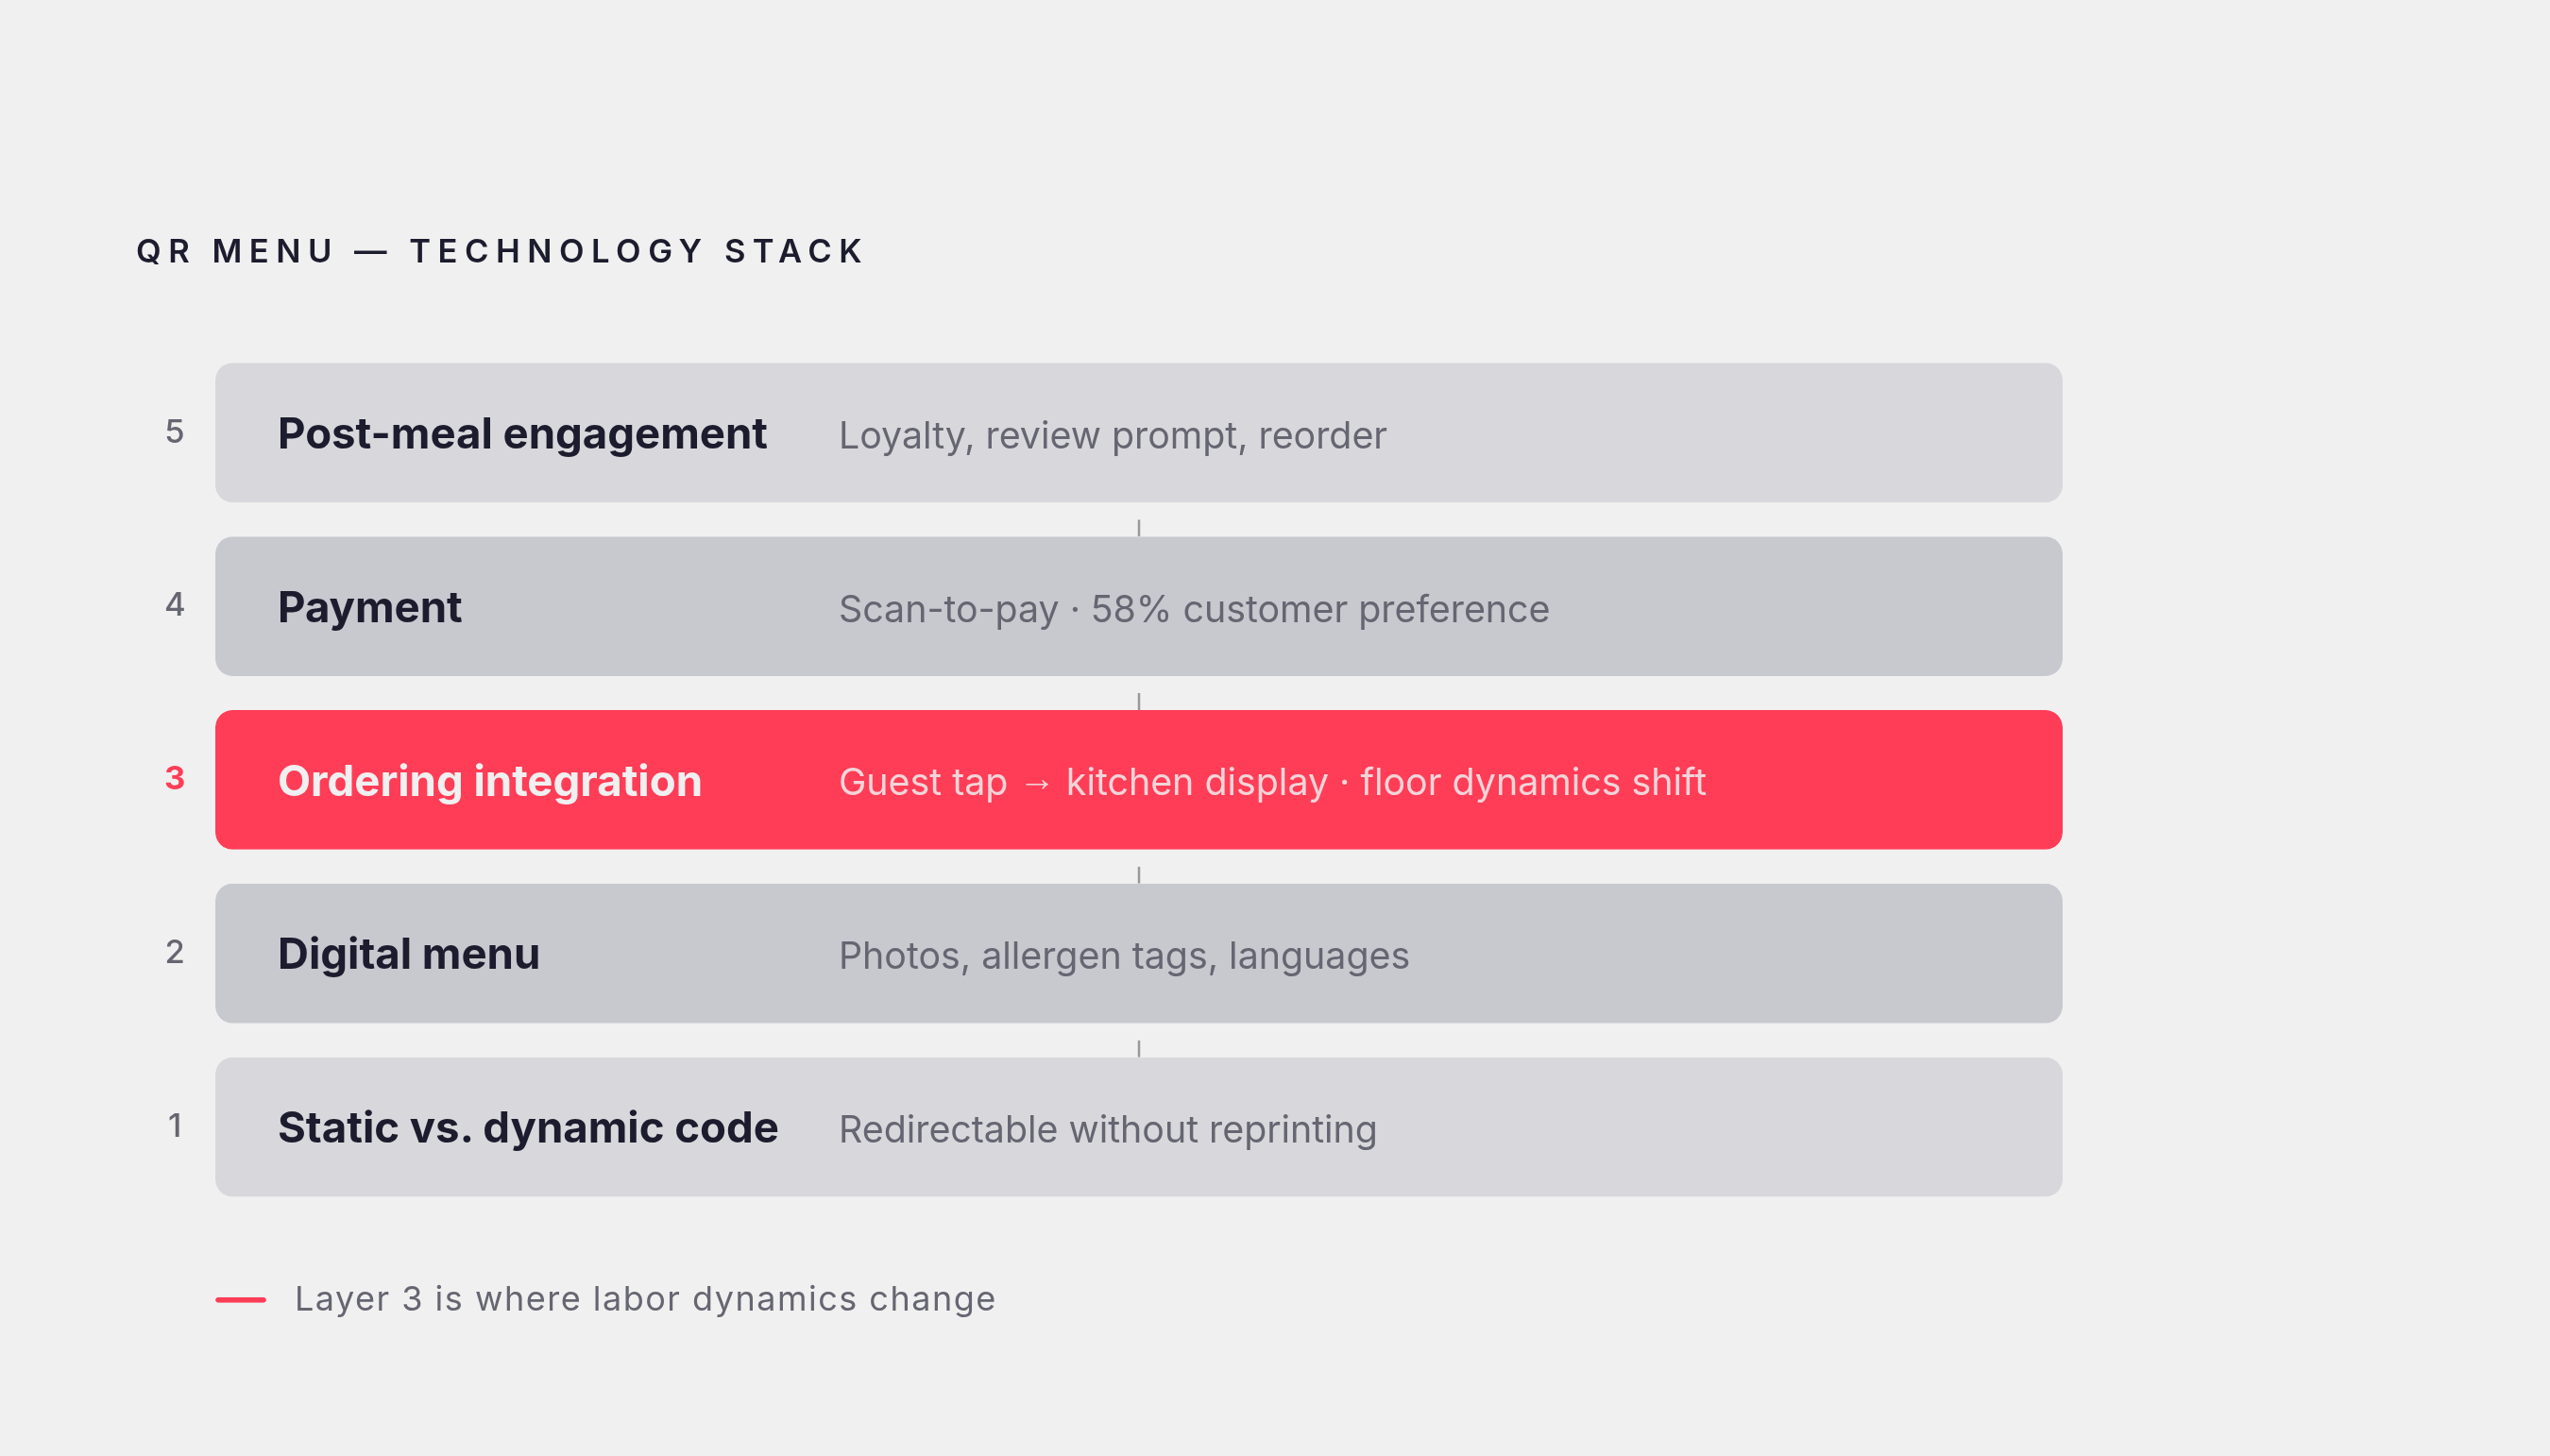
Most of the confusion around QR menus comes from treating the whole thing as one product, when it's really five layers stacked on top of each other, and any given restaurant might only be using one or two of them.
Layer one is the code itself, and the distinction that matters here is static versus dynamic. A static code points to one fixed destination forever. A dynamic code can be redirected on the back end, so the menu behind it updates in real time without anyone reprinting a table tent. That distinction sounds minor. It isn't, and it comes back with a vengeance in the deployment-failures section further down.
Layer two is the digital menu itself: mobile-friendly layout, photos, allergen tags, multiple languages if the guest list calls for it. A PDF technically checks the box here. Functionally, it's a weak substitute, closer to faxing a menu to someone's phone than building one for it.
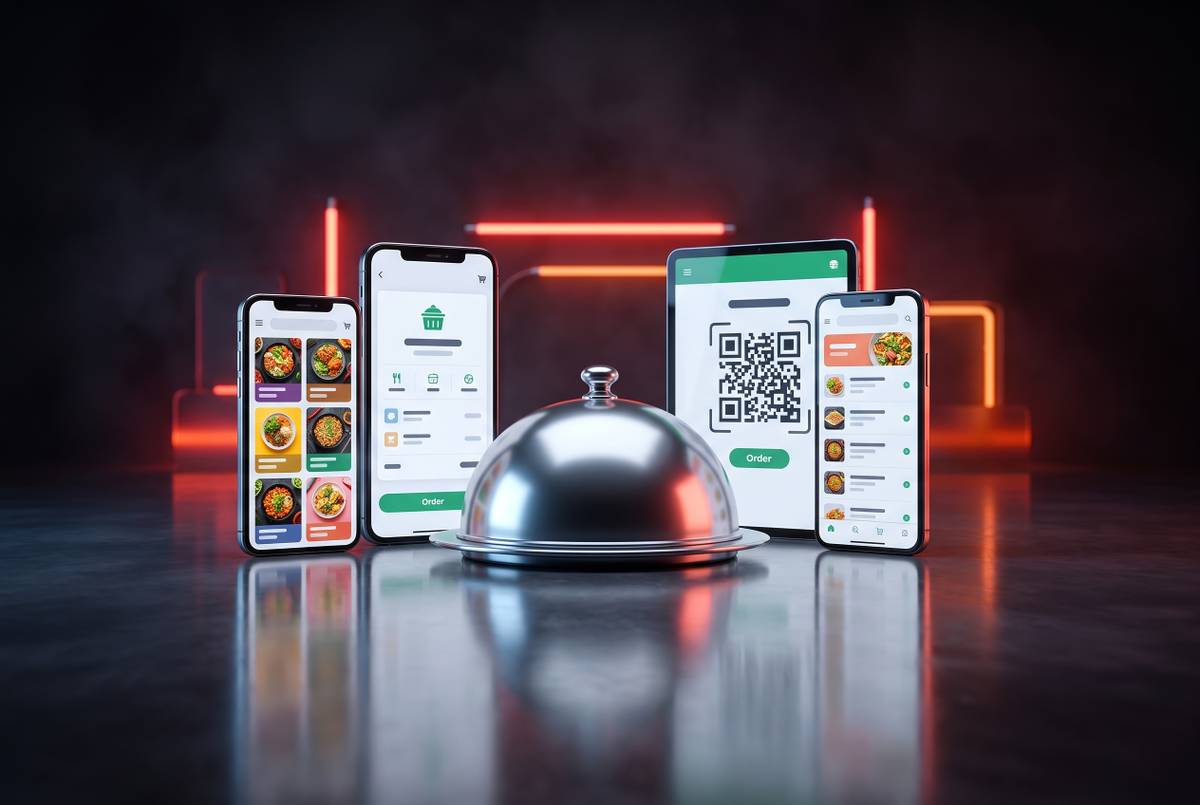
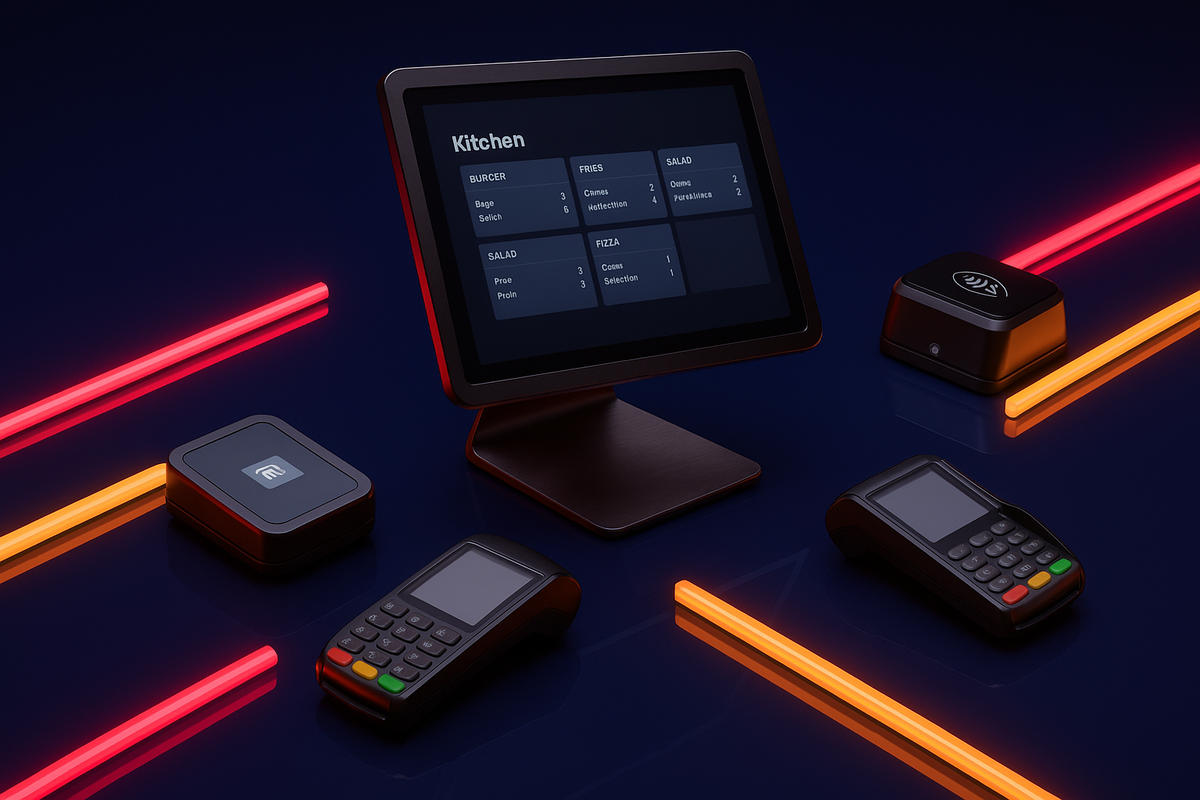
Layer three is where ordering integration lives, so the guest's tap-in flows straight to a kitchen display. This is the layer where labor dynamics actually shift, not layer one. A code that just shows a menu doesn't change how the floor runs. A code that routes an order to the kitchen does.
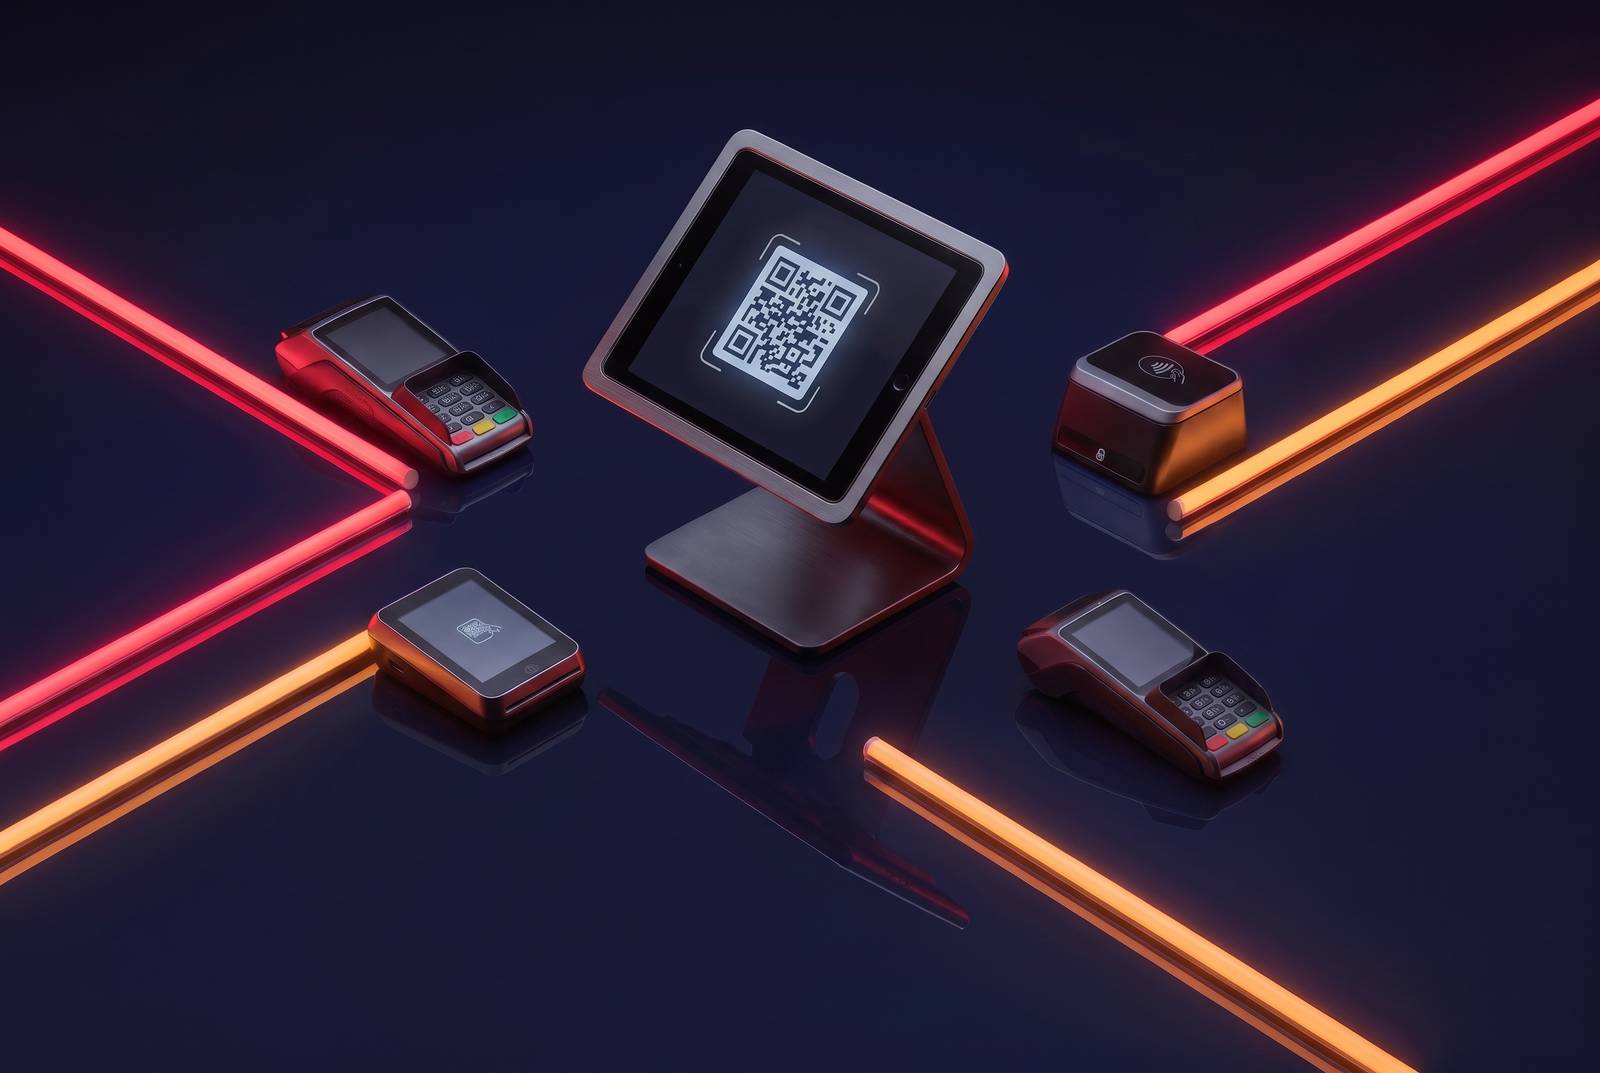
Layer four is payment. Scan-to-pay removes the checkout bottleneck outright, the one where a table's ready to leave and stuck waiting on a card machine that's three tables away. OneHub POS data, via OrderOut, found 58% of customers prefer QR payment at restaurants over the traditional route.
Layer five is what happens after the check closes: loyalty sign-up, a review prompt, a reorder link, all triggered by a code on the receipt or the tabletop.
No vendor owns all five layers, and no restaurant needs to buy them all at once. OrderOut summed up the actual evaluation question well: "The question isn't whether diners have seen a QR code before. They have. The question is whether your setup reduces steps or adds them." POS integration is the hinge point. Without it, someone on staff is retyping every order by hand, which defeats the entire premise.
The operational gains: table turnover, labor flow, and menu accuracy
Three levers appear consistently across the data: how fast tables turn, how labor gets redeployed, and how accurate the menu stays.
On turnover, a Square study cited via MenuTiger found a 15% jump in table turnover at restaurants that adopted QR-based payment specifically. Payment is the cleanest friction point in the entire dining sequence to remove, since it's the one step where everyone's just waiting on a card machine or a server's attention.
Labor reallocation is a subtler story than "cut headcount." Servers freed from delivering physical menus, taking a third round of drink orders, or running a printed check can put that time into upselling and actually talking to guests. The gain isn't fewer people on the floor. It's the same people doing less busywork and more of the job that actually drives revenue and hospitality.
The hybrid model matters here too. QR ordering works best as a supplement to service, not a replacement for it. Repeatable items, drink refills, side orders, dessert, are the natural fit, along with peak periods when the floor is stretched thin and a server physically cannot get to every table fast enough.
Menu accuracy might be the most underrated benefit in the whole conversation. Supercode's 2026 data found digital menu adopters update their menus 4.2 times more often than restaurants running printed ones, and that update frequency translates into a 57% drop in menu-related complaints, wrong prices, items that ran out, allergen confusion that could've been avoided. Real-time inventory tie-in means if the halibut sells out at 7 PM, it disappears from the menu that minute instead of getting "discovered" by an embarrassed server five tables deep into a dinner rush.
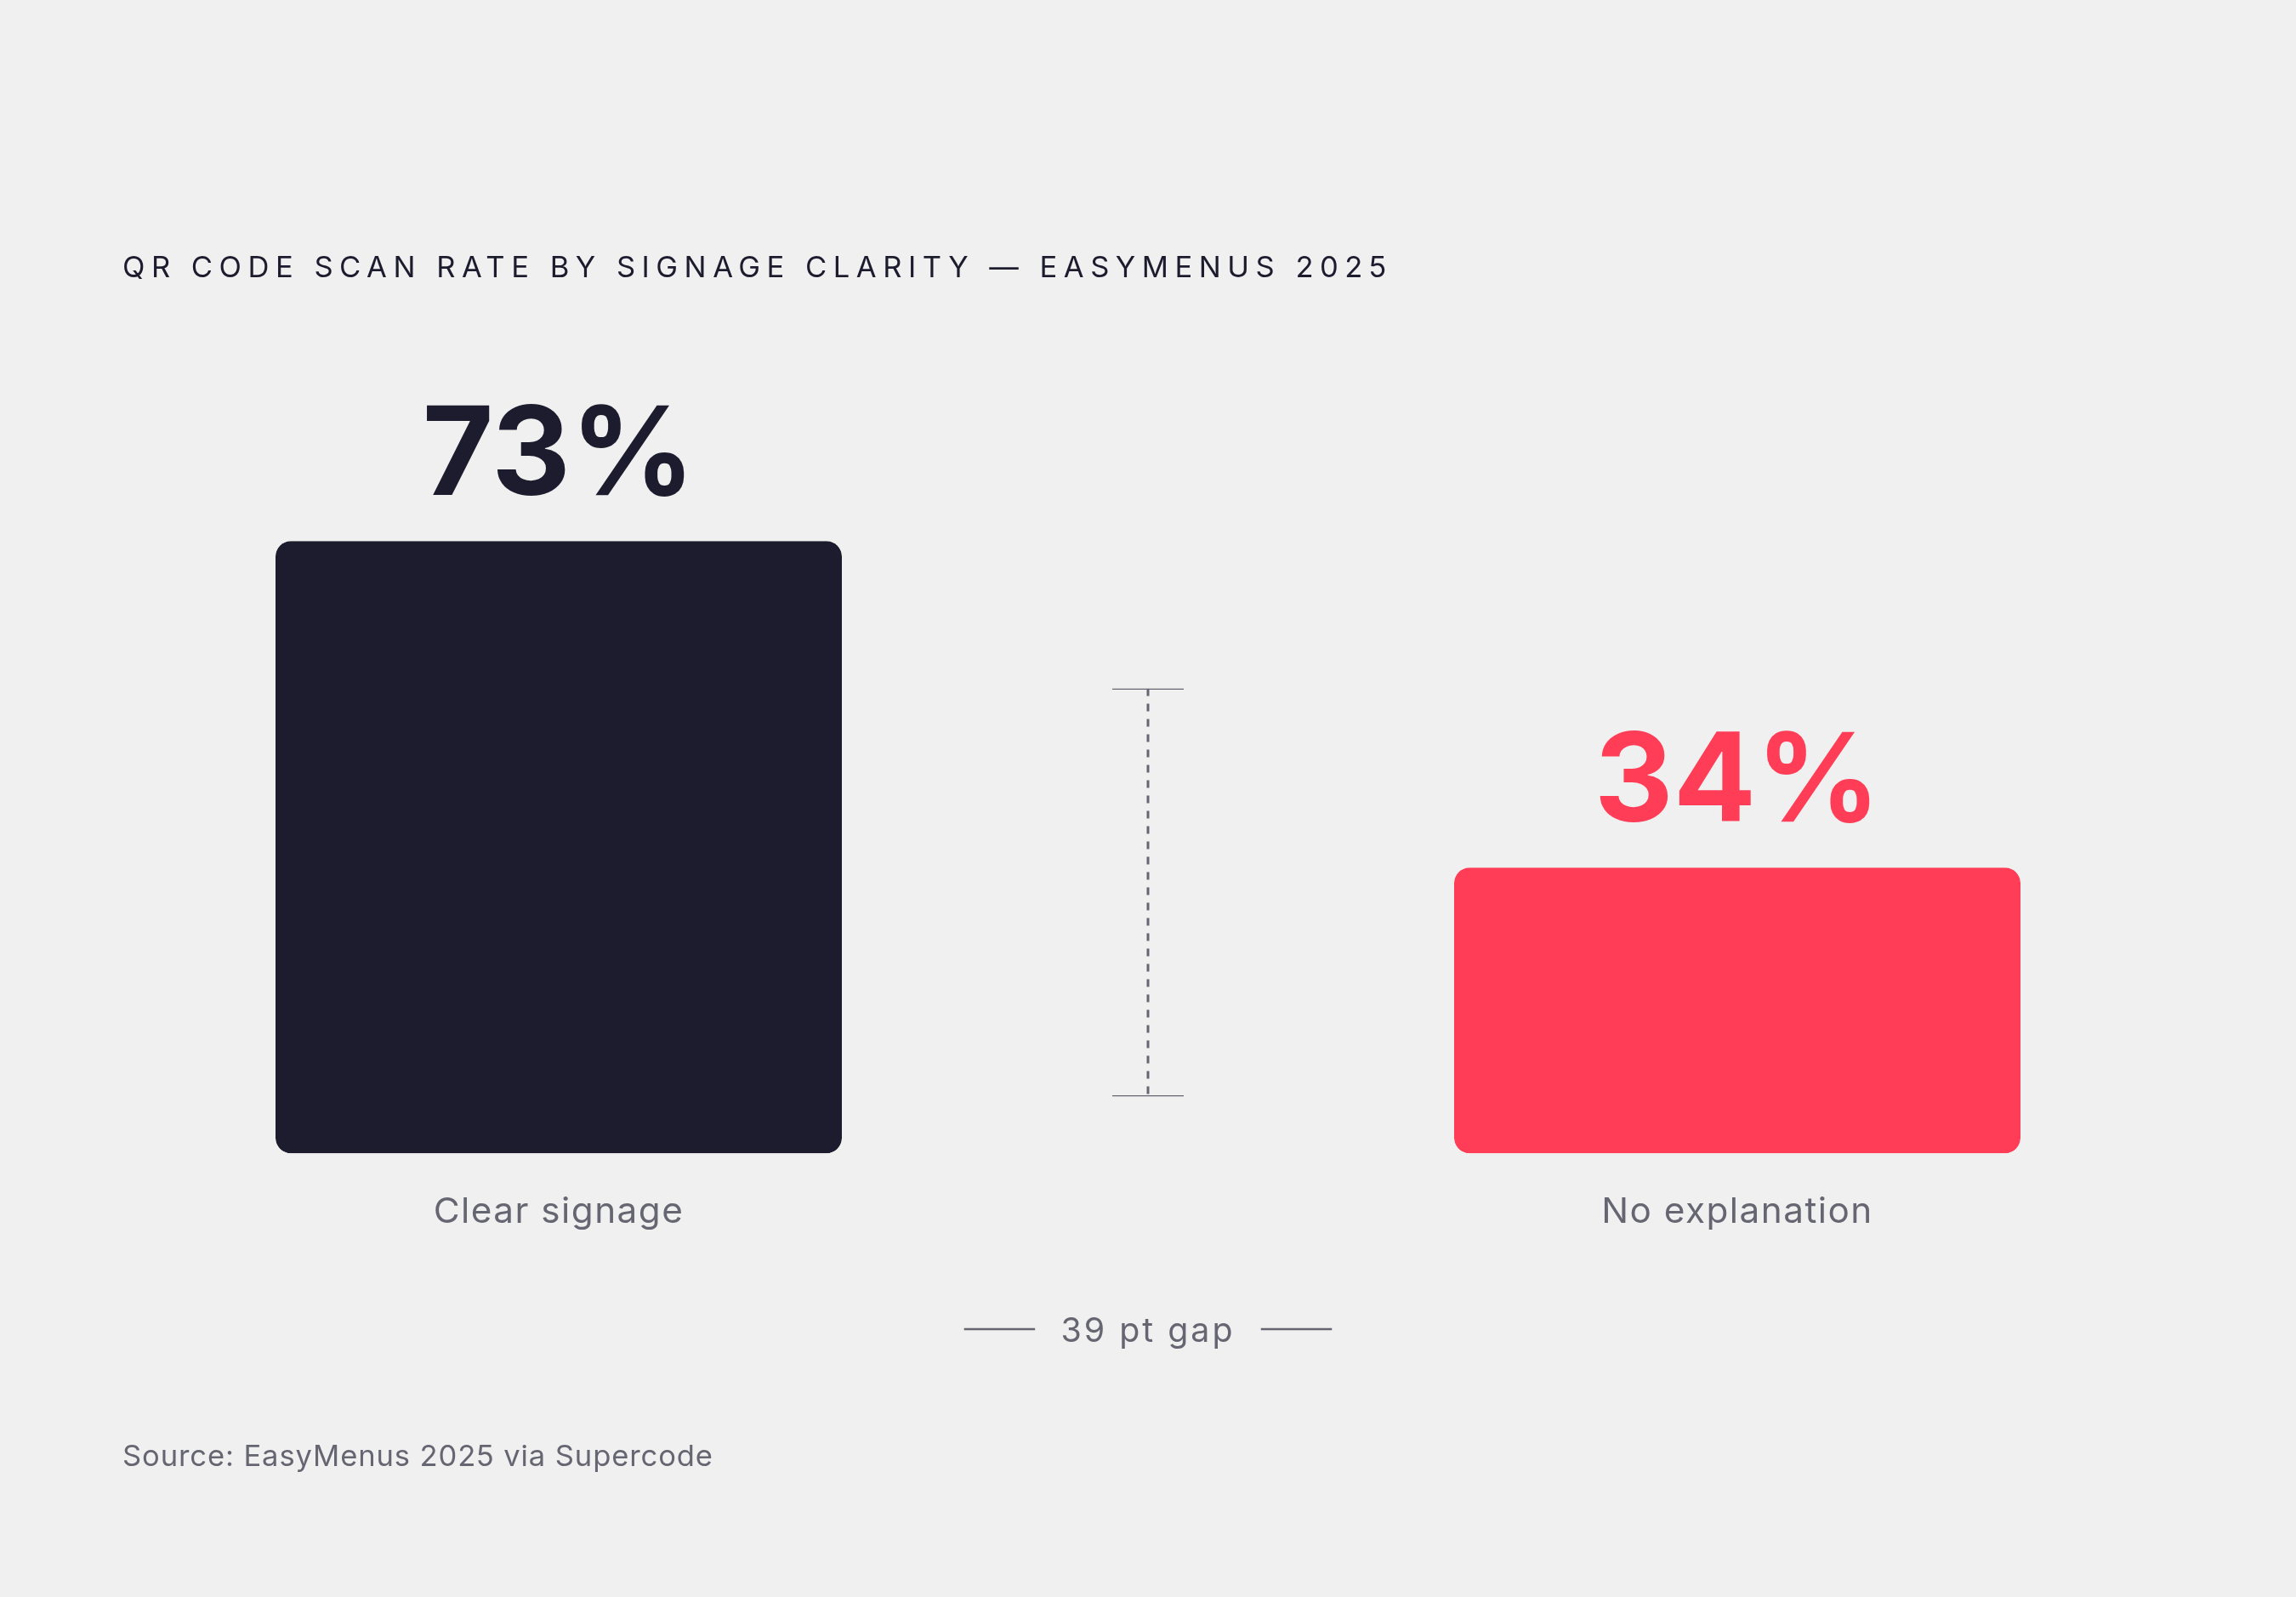
None of this works if guests don't scan the code in the first place, and scan rate is not a given. EasyMenus 2025 data, via Supercode, found a 73% scan rate when table signage clearly explains what the code does, versus 34% when it doesn't. Where the code sits and what it says next to it isn't an afterthought. It's half the system.
The revenue case: average check size, upsells, and what the numbers honestly support
Average order value is the number every vendor wants to lead with, and it's worth being straightforward about how wide that range actually is. QRCode.co.uk reports 20 to 30% higher average tickets at restaurants running full digital ordering. Supercode cites studies showing up to 30% higher AOV for mobile ordering versus table service alone. Data cited by Supercode found self-serve QR platforms driving a 35% sales increase. Those are the headline figures, and they're also the ceiling, not the floor.
TableQR's 2026 modeling guidance is the more honest baseline: for a restaurant with a mobile-friendly, photo-rich menu and upsell prompts placed at the right moments, a 5 to 10% lift in average check is the realistic starting range. Building a business case off the 35% number is like planning a road trip based on your car's best-ever highway mileage. Technically achievable under ideal conditions. Not what's going to happen on the actual drive.
Why does the lift happen? Guests browsing a menu on their own phone aren't under the same time pressure they feel with a server standing at the table. Photos surface dishes that never would've landed if just spoken aloud. And upsell prompts appear exactly when a guest is already in a decision-making mode, like right after finishing a drink or right as the entrée plates get cleared.
AI-driven upsell tools take this further, reading purchase history and time-of-day patterns to personalize what shows up in the digital menu itself. Dataintelo reported pilot programs seeing AOV increases in the 8 to 14% range once these prompts were switched on. Generative AI is expected to push this further, per Dataintelo, letting operators A/B test descriptions, pricing, and allergen call-outs inside the same menu without reprinting a thing.
There's a cost-side story too that rarely gets mentioned in the same breath as the revenue one. EasyMenus tracked over 10,000 restaurants between 2020 and 2025, via Supercode, and found independents spending an average of $3,847 a year on menu printing alone. A dynamic QR menu swaps that recurring cost for a flat monthly subscription, and for restaurants that reprint often, seasonal menus, frequent price changes, break-even typically runs three to six months, per Supercode.
The honest framing, then: the revenue case holds up on the numbers, but it's conditional on execution. A photo-rich system with actual upsell logic behind it and integration into the point-of-sale outperforms a static PDF linked off a table tent, and that gap is not small.
The data a QR system collects, and why that data matters beyond the menu
Every scan leaves a trail. Which items get viewed most, what time of day drives the most engagement, which tables generate the most scans, what tends to get ordered together, all of it is logged the moment a guest's phone hits that code.
Supercode's 2026 figures found 95% of businesses reporting that QR codes help them collect useful first-party data on customer preferences and behavior. That's a sweeping number, sure, but the mechanism behind it is concrete and traceable: scan events, item views, order history, and dwell time are all recordable at the individual session level, not just as an aggregate.
This is first-party data. Collected by the restaurant, owned by the restaurant, not filtered through a third-party ad platform that decides what to show you and what to keep for itself. QRCode.co.uk notes restaurant owners are increasingly stacking loyalty integrations and scan analytics dashboards on top of the QR menu itself, turning the menu from a one-time transaction point into the front door of an actual ongoing relationship.
That's also where marketing enters the picture, because knowing what a guest ordered, at what time, at which table, starts to close a gap that most restaurant marketing never actually closes: the one between an ad someone saw online and what they did once they physically walked in the door. Meta and TikTok will tell an operator about clicks and impressions. The POS will tell them about revenue. QR ordering data sits closer to the revenue side of that gap than almost any other touchpoint a restaurant fully controls.
Loyalty integration sharpens this further. Industry data broadly shows loyalty members tend to visit more often and spend more per check than non-members. A QR-triggered loyalty sign-up is the moment an anonymous guest turns into a tracked one, which changes how that guest can be marketed to and measured going forward.
Where QR menus fall short in deployment
The technology is rarely the actual problem. Deployment decisions are, and they tend to repeat across the industry in fairly predictable ways.
The most common one: a confusing menu path. Too many modifier screens, categories buried three taps deep, formatting that wasn't tested on an actual phone screen. A bad digital menu is worse than a paper one, the same way a self-checkout kiosk that jams on the first scan is worse than just standing in a normal line.
Another failure mode: treating the QR code as the only human touchpoint in the meal. Guests still want someone accountable when something goes wrong, and stripping out all service interaction in favor of full self-service tends to tank satisfaction scores and reviews right along with it.
Then there's the integration gap. A QR menu that doesn't talk to the kitchen display creates a manual relay step, staff re-entering orders by hand, which quietly erases whatever labor savings the system was supposed to deliver. It's the digital equivalent of hiring an assistant and then still doing all the work yourself because you don't trust their handwriting.
Static codes deployed like they're dynamic is its own special kind of mistake. If the code can't be updated without reprinting, none of the accuracy benefits discussed earlier apply, whether the destination is a PDF or anything else. A dynamic code, on the other hand, can be redirected on the back end any time without a single reprint.
Placement failures round this out. That gap between a 73% scan rate and a 34% one, again from EasyMenus 2025 via Supercode, comes down almost entirely to whether the signage explains what the code is for. A brilliant back-end system sitting behind an unlabeled sticker on a napkin holder is not going to get scanned.
QR menus are not universally loved. Older guests, and guests in higher-service dining contexts, often still want a printed menu or a server's recommendation, full stop. A hybrid approach, code available but not mandatory, avoids alienating exactly the guests who'd otherwise walk out unimpressed. OrderOut's framing applies squarely here: "If scanning a code creates more taps, more waiting, or more manual entry for staff, the system isn't helping your restaurant operations."
How to evaluate QR menu systems before committing
The real evaluation question isn't "does this have QR ordering." Every vendor has QR ordering. The actual question is whether the system closes the loop between what a guest does and what an operator can see on the back end.
Start with dynamic versus static. Non-negotiable for any restaurant that changes prices, runs specials, or rotates seasonal items, which is to say, most restaurants.
Then POS integration. Ask the vendor how an order shows up on the kitchen display and whether that requires custom development work on top of the base product, because "yes, it integrates" and "yes, it integrates after eight weeks of custom build" are two very different sales pitches.
Analytics depth affects whether a scan can be tied to revenue or only to traffic. Scan counts alone are table stakes at this point. Look for session-level data that ties a scan to an actual order outcome, not just a number that says how many people looked.
Payment integration deserves specific attention, since without scan-to-pay, that 15% turnover bump from the Square study isn't fully realized.
Loyalty and review triggers are the piece that turns a transaction into a marketing asset: can the system prompt a sign-up or a review request right as the meal wraps up?
Test the mobile experience on an actual phone, not a laptop browser mimicking one, before any of this goes live. Load time, photo quality, and how many taps it takes to add a modifier are the difference between an order that finishes and one that gets abandoned halfway through.
And on contracts: operators shouldn't need a year-long commitment or a big upfront check to access a working system. Given that the printing-cost break-even alone typically runs three to six months per Supercode and EasyMenus, a vendor demanding a much longer lock-in is asking for more patience than the math justifies. Vendors named in the upsell-technology space, per Dataintelo, include Toast, Olo, and TabSquare, though fit should always come down to how well a system integrates with the point-of-sale already running the kitchen, not which name is more recognizable.
Connecting QR data to marketing spend: why attribution is the missing step
QR menus generate first-party behavioral data. Marketing campaigns generate traffic. The gap sitting between those two systems is roughly where a lot of restaurant ad spend just evaporates.
The scale of that problem isn't restaurant-specific. a significant share of digital ad budgets can produce no measurable business impact at all, and the Association of National Advertisers found that of every dollar entering a demand-side platform, only a fraction ever reaches an actual consumer, the rest absorbed by intermediary fees and misaligned incentives along the way. That's not a restaurant problem. That's a whole industry problem that restaurants happen to inherit.
The restaurant-specific version of it looks like this: Meta and TikTok report clicks and views, the POS reports revenue, and QR ordering data sits in the space between the two without being wired to either one automatically. What closes that loop is attribution, specifically the ability to connect the ad a guest saw to the visit they made and the check they ran. QR data alone doesn't do that. QR data paired with an actual tracking layer gets a lot closer.
TastyIgniter's 2026 guidance suggests established independents put 3 to 6% of total revenue toward marketing, with 60 to 70% of that going to digital channels. The same source found micro-influencer partnerships generating 500 to 800% ROI compared to traditional advertising, a gap large enough to make anyone reconsider where the next marketing dollar goes. Local creator content matters here specifically because those audiences already live near the restaurant. They're the ones who can actually walk in the door, which is the whole point. Reach that doesn't turn into a physical visit raises the identical measurement issue from a different angle.
The practical takeaway for an operator is encouraging but unfinished. Rolling out a QR ordering system is a real step toward closing the data gap between marketing and revenue, but it only gets there paired with attribution that tracks which ad actually drove which visit. Without that pairing, the QR data explains what a guest ordered without ever explaining why they showed up. QR menus made restaurant operations measurable down to the table. The next fair question for any operator to sit with is whether their marketing is measurable with anything close to that same precision.
Sources
- QR Code Menu Forecast 2026
- QR Codes in Restaurants: A 2026 Guide for Operators
- QR Code Ordering: From Trend to Standard in 2025
- QR Codes for Restaurants: Menus & Ordering (2026) | Supercode
- QR Codes for Menus: Digital Menus & Ordering | Supercode
- QR Code Menus: Future Trend or Here to Stay? The 2026 Reality Check
- QR Code Menu ROI in 2026: Costs, Check Size and Data
- QR Code Statistics for Restaurant Usage in 2026