Measuring the Impact of UGC on Restaurant Revenue
Connecting social media posts to actual restaurant sales reveals where marketing dollars really go.
Restaurant industry sales are expected to hit $1.55 trillion nationwide in 2026, according to the National Restaurant Association's State of the Restaurant Industry report. Average net margins run 3% to 5%. That gap between the size of the number and the thinness of the margin is the entire reason UGC measurement matters, because at a margin that thin, a marketing dollar spent without knowing what it returned isn't just wasted, it's actively eating into the tiny sliver of profit the whole operation runs on.
Restaurant365's State of the Industry Survey found that 39% of restaurant leaders are prioritizing marketing investments more than any other operational category. So the highest-priority line item is also, in most restaurants, the least measured one. Follow the money and it splits into two places that don't talk to each other: engagement data lives inside Instagram, TikTok, and Google, while revenue data lives inside the POS. Nothing connects them by default. One brain knows who liked the brisket photo, the other brain knows who paid for the brisket, and as of right now, they've never met.
This piece walks through how to introduce them.
What counts as UGC for a restaurant and why it behaves differently from branded content
For a restaurant, user-generated content is anything a guest creates rather than anything the marketing team produces, including a photo of the ramen bowl, a TikTok filmed at the table, a tagged Instagram story, a Google or TripAdvisor review, and a check-in at the host stand. None of it comes from a brief. All of it comes from someone who paid to be there.
It helps to sort UGC by where it sits in the funnel, because each type does a different job. Discovery UGC is the public post or hashtag that reaches someone who has never heard of the restaurant, the friend-of-a-friend scrolling past a tagged photo. Consideration UGC is the review on Google, Yelp, or TripAdvisor that someone reads while actively deciding where to eat tonight. Repurposed UGC is what happens when the operator takes a guest's photo or video and runs it as a paid ad or posts it to the restaurant's own feed, borrowing someone else's camera work for the brand's own purposes.
Why does any of this outperform a polished branded shot? Emplifi data shows 84% of diners want to see food photos on social media before they visit, and research consistently finds that a majority of diners check a restaurant's social presence before choosing where to eat. That's not idle scrolling, that's pre-purchase research, the digital equivalent of pressing your face against the restaurant window before walking in. UGC feeds that moment because it reads as testimony, not advertising. A stranger's photo of a dish carries a credibility a studio shot never quite earns, the same way a friend's restaurant recommendation lands harder than a billboard ever could.
Each of these three types (discovery, consideration, repurposed) needs its own measurement approach, which the framework sections below will get into one at a time rather than lumping them together.
The vanity-metric trap: what engagement numbers tell you and what they don't
Ask most restaurant marketers how a campaign performed and the answer arrives in likes, impressions, follower growth, or engagement rate. Ask a follow-up question, "so what decision does that number let you make," and the conversation usually stalls.
A post racking up thousands of likes from users three states away does not fill a Tuesday lunch shift. TikTok's average engagement rate is widely reported to outpace older platforms, with relatively low cost-per-thousand-impressions among major platforms, numbers that look efficient on a media plan. But reach without local intent isn't a reservation, it's just a lot of people who saw a video and kept scrolling.
Some engagement signals earn more trust than others. Saves and shares correlate with future visit intent more directly than any other organic metric, because saving a post is a small act of planning: someone intends to come back to it later, probably when deciding where to eat. Likes don't carry that weight; a like is passive approval, the digital nod, gone in half a second and meaning almost nothing about what happens next. Comments matter more when they ask something specific, "what's the address" or "is this near the west side," because those are people doing the mental work of turning interest into a visit. A comment count alone doesn't distinguish between ten people asking for directions and ten people just typing "yum."
Meta and TikTok report what their own platforms are built to measure, which is clicks, views, and CPM, not whether a specific post drove a specific person through a specific door. Platforms grade their own homework. That's not a conspiracy; it's just incentive, because the metrics available by default are the metrics that make the ad platform look good, not the metrics that tell an operator whether Tuesday lunch got busier.
How the path from a social post to an in-store visit works
Picture the guest journey in four stages, because that's roughly how it happens for most people, most of the time. Awareness starts when a guest sees a friend's TikTok or a tagged post; research suggests 87% of food-related Instagram searches lead to a restaurant visit within 48 hours, which is a strikingly fast turnaround for a purchase decision that usually involves reservations, schedules, and other people's opinions. Consideration follows: the potential diner checks the restaurant's own profile, reads a few Google reviews, maybe taps through to the menu. Decision comes next, whether that's a reservation link, a directions click, a phone call, or just walking in. The POS system actually witnesses only the transaction stage, made up of the sit-down, the order, and the payment.
The attribution gap lives squarely between consideration and decision. By the time someone books a table, they may have touched a TikTok video, an Instagram Reel, two Google reviews, and a text from a friend, all before opening the reservation app. Last-click attribution, the default logic in most analytics tools, assigns full credit to whichever touchpoint happened to have a trackable link at the final moment, and quietly erases everything that came before it. It's a bit like crediting the last person who touched a relay baton with running the whole race.
Diners also move across channels in ways that resist clean tracking: some click a digital ad, some call the restaurant directly, some just walk in off the street, and some book online, often more than one of those in sequence. That multi-touch reality is exactly why single-platform measurement understates what UGC contributes; if the only tool measuring impact lives inside Instagram, it will only ever see the fraction of the journey that happened inside Instagram.
The fix starts with naming the decision points where data can actually be captured, including a reservation link click, a promo code redemption, a check-in offer, and a WiFi login at the door. Each of those isn't just a guest convenience, it's a place where the restaurant can write something down.
Building the measurement chain: connecting UGC to in-store revenue without enterprise software
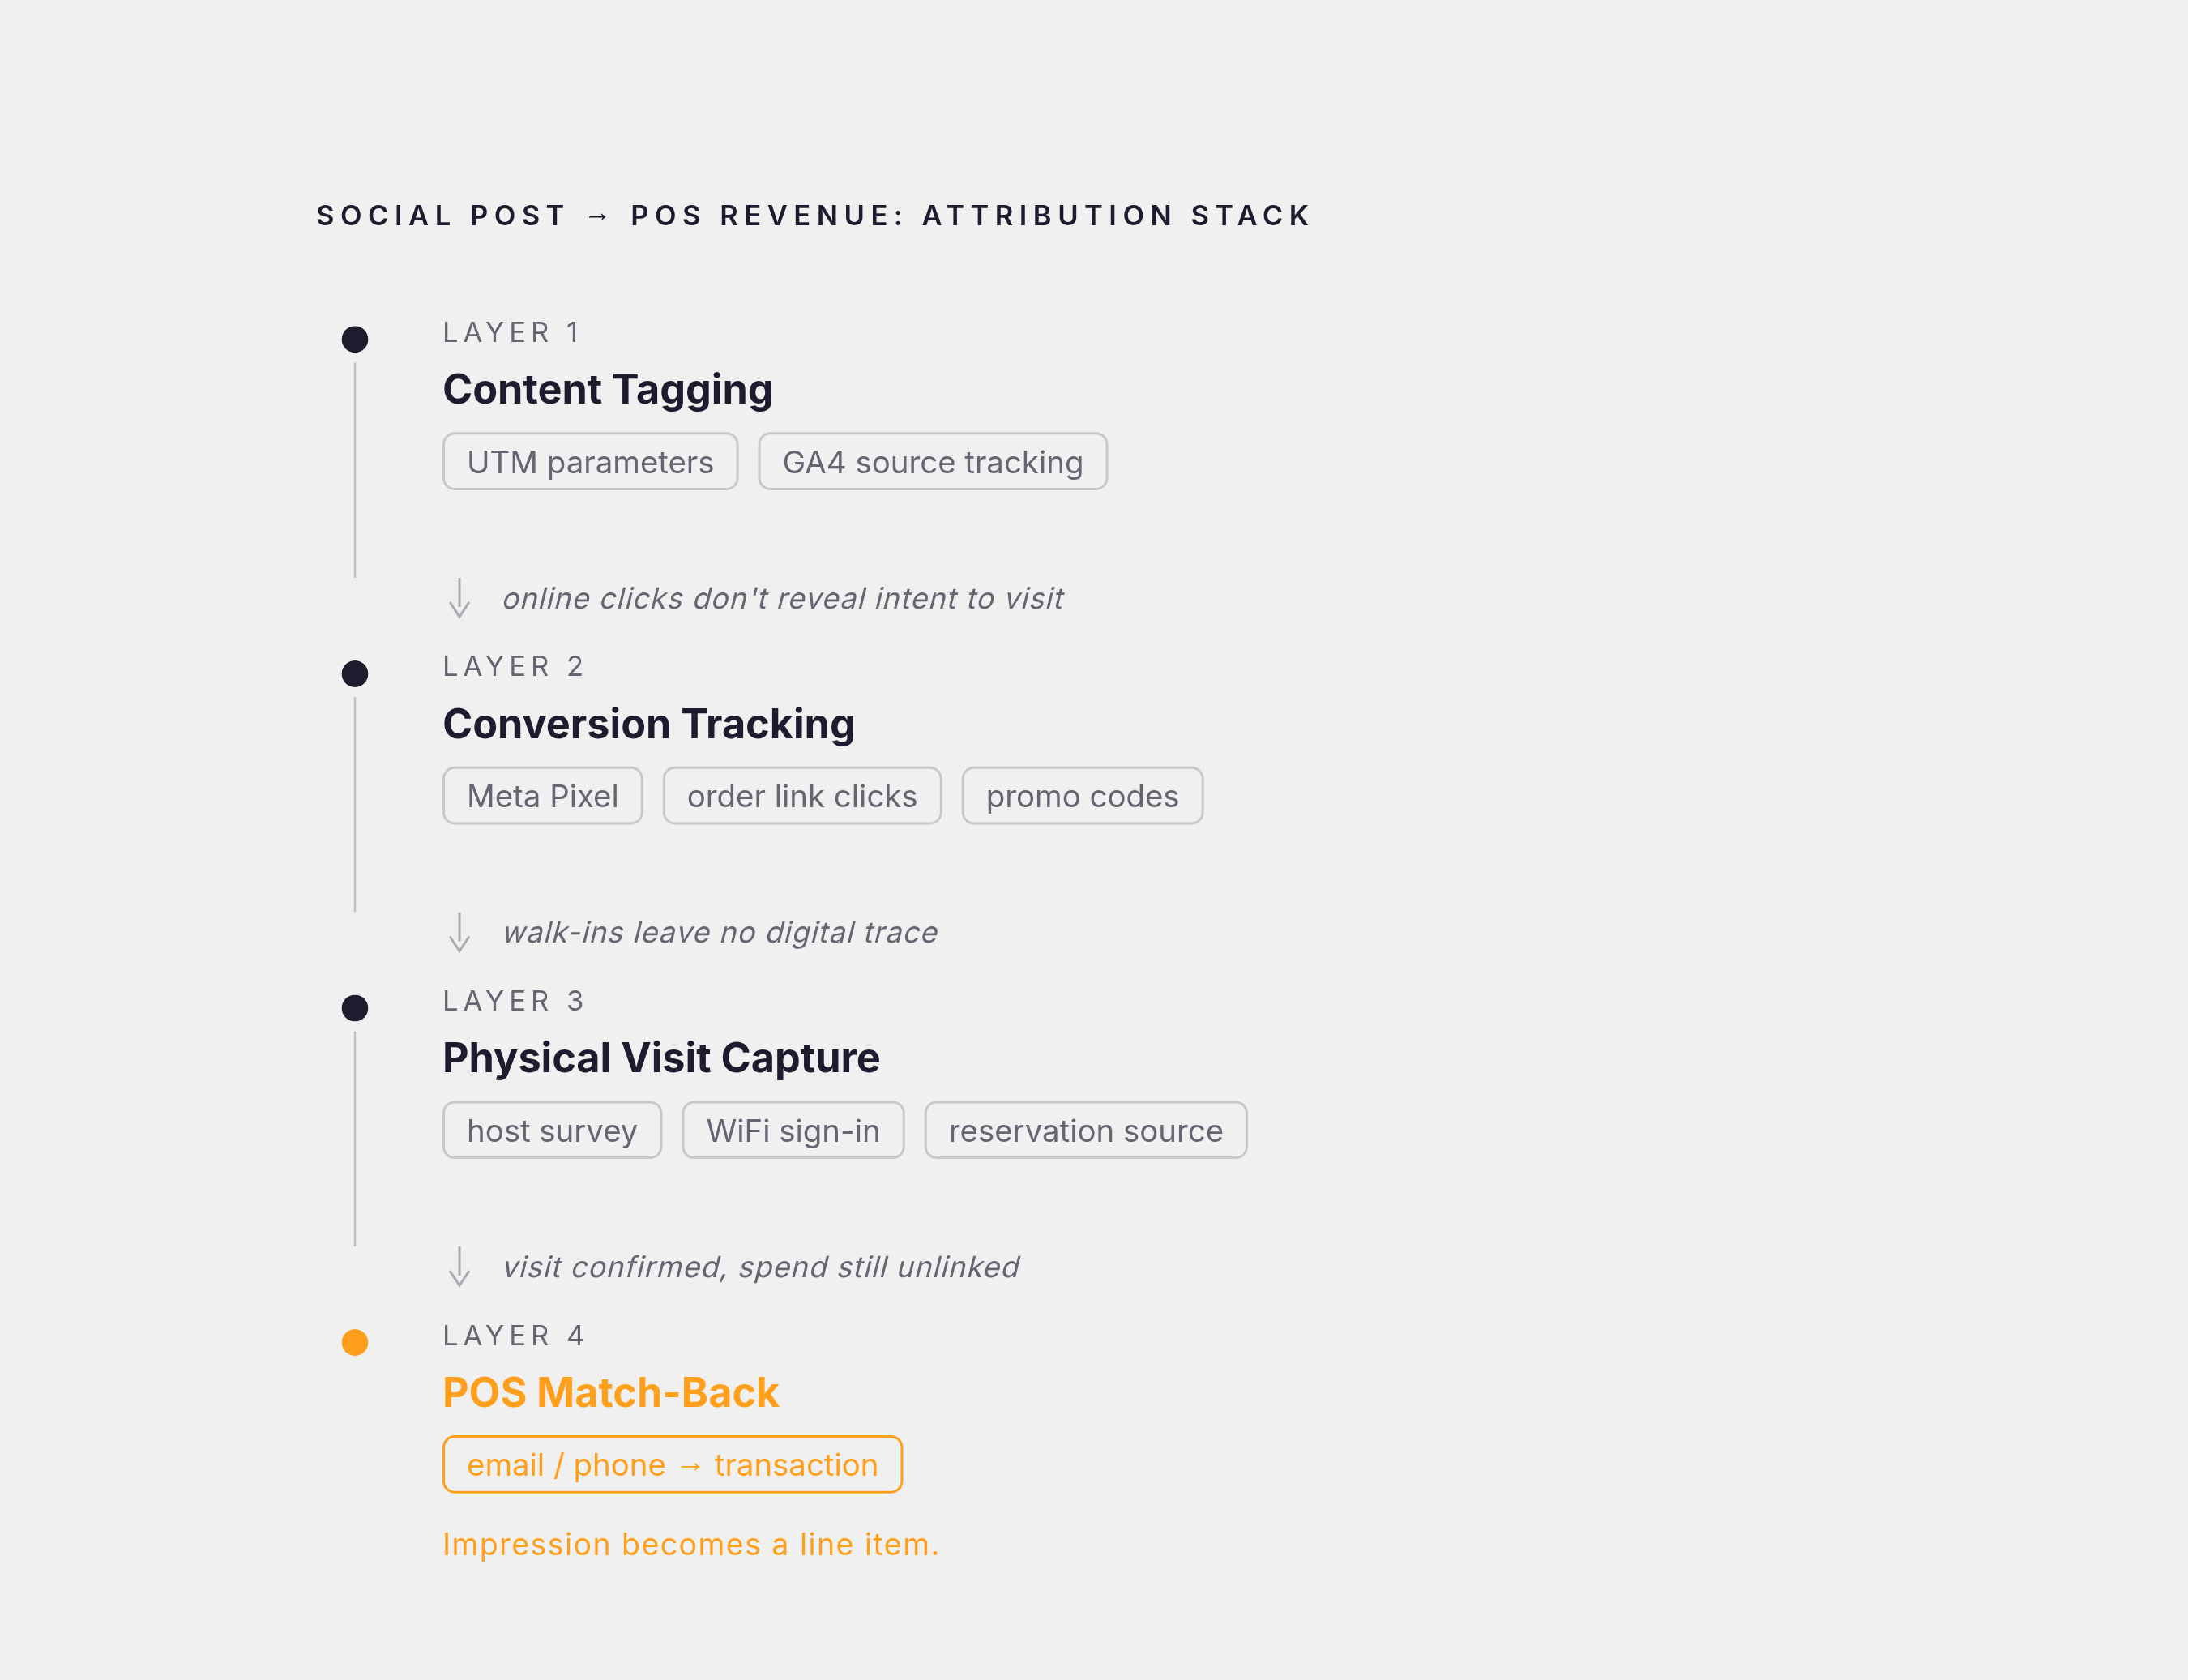
None of this requires a data science team or a six-figure software contract. It requires four layers, stacked in order, each one closing a gap the layer before it couldn't.
Layer one is content tagging: UTM parameters on every link shared in a UGC campaign, in bio links, in story swipe-ups, so Google Analytics 4 can tell a restaurant where its website traffic actually came from instead of lumping it all into "social." Layer two is conversion tracking on owned digital touchpoints: a Meta Pixel installed on the reservation page, click tracking on the online ordering link, and unique promo codes assigned per campaign. Layer three is physical visit capture, which happens at the door rather than on a screen: a host asking "how did you hear about us," a WiFi sign-in, a source field inside the reservation system, waitlist app data. Layer four is the POS match-back, tying the email or phone number captured at booking or WiFi login to the actual transaction record. That fourth layer is the one that closes the loop, the moment a social impression becomes a line item.
Four metric categories map onto that same funnel: awareness (reach, impressions), engagement (saves, shares, comments, deliberately not likes), conversion (reservation clicks, order link visits, promo redemptions), and revenue (attributed covers, average check). Track all four and a restaurant can finally answer the question that engagement dashboards can't: did this post make money, and how much?
For independents without the appetite to build a four-layer stack, unique promo codes assigned per creator or per campaign are the simplest closed-loop method available. The code gets redeemed at the register, which is the attribution event itself, no pixel or dashboard required.
One restaurant operator spending roughly $2,000 a month on Facebook ads was found to be missing 30% to 40% of phone calls during peak hours, simply because no one picked up. Measurement didn't reveal a creative problem, it revealed an operational one; the ads were doing their job, the phone just wasn't. Scaling ad spend into a funnel with a broken step at the bottom doesn't fix the step, it just wastes more money finding it.
What good ROI looks like for restaurant UGC campaigns
For digital channels where performance is trackable, a marketing ROI between 300% and 500%, or $3 to $5 back per $1 spent, is considered strong for digital marketing by industry benchmarks. That's the honest target, not a fantasy number pulled from a case study slide.
The catch is that this benchmark is only visible to a restaurant that has built the measurement chain described above. An operator running an unattributed UGC campaign has no way to know if the return sits above that range, below it, or somewhere in the fog in between. The number exists, but it's invisible without the tracking to see it.
Loyalty programs offer a useful comparison, precisely because they're already fully measurable by design. Data from Paytronix, Talon.One, and Restroworks covering 2025 to 2026, cited via restaurantvelocity.com, shows 90% of operators running loyalty programs report positive ROI, averaging 4.8x, with members visiting about 20% more often. Loyalty programs get measured well because the infrastructure to measure them, a login, a point balance, a redemption, is baked into the product itself. UGC can reach that same clarity, it just needs the same discipline applied to it, on purpose, rather than left as an afterthought.
Platform-level numbers back this up further. Meta remains the strongest channel for restaurant categories, with a reported 6.9x return on ad spend and a cost-per-reservation-conversion around $14.20, and those figures tend to improve when the creative running in the ad is guest-generated rather than studio-produced. Google Ads generated an average return of $8 for every $1 spent in 2024, a number that matters for UGC specifically because guest reviews contribute to a restaurant's broader online presence that paid search campaigns operate alongside.
How local creators fit into a UGC measurement strategy
Organic UGC (a guest posting unprompted) and creator-generated UGC (an operator briefing a local food creator) both count as UGC, but they're not equally easy to trace. Creator content is measurable from the first handshake, because the operator controls the brief, the link, and the code before a single frame gets shot.
The case for local creators isn't really about aesthetics, it's about geography. A food account with a few thousand followers, all within driving distance, sends more actual foot traffic than a macro-influencer with a huge following scattered across cities the restaurant will never serve. Reach matters less than reachable matters. Industry research indicates 55% of users say they've visited a restaurant after seeing its food featured on TikTok, and that statistic only translates into revenue if the audience seeing the video can plausibly show up.
Measuring creator campaigns follows the same logic as the promo-code approach above, applied per person: assign each creator a unique code or UTM-tagged link as the attribution anchor, track redemptions at the POS against that specific code, then divide covers attributed to that creator by the fee paid to produce a real per-creator ROI number. Repeat the process with the creators who perform, and retire the ones who don't. That loop, measure, compare, repeat, is what separates a creator marketing system from a series of one-off bets on vibes.
Encouraging and collecting UGC worth measuring
Not every UGC campaign should chase the same outcome, and the campaign model ought to follow the goal rather than the other way around. A goal of boosting brand awareness fits a branded hashtag campaign, measured by hashtag usage, reach, and impressions. A goal of promoting a new menu item fits a photo or video contest built around that dish, measured by submission volume and engagement. A goal of increasing bookings or foot traffic fits a check-in campaign paired with a small discount, measured by check-in counts and offer redemptions. A goal of building social proof fits a review-generation push, measured in new review counts and average star rating. A goal of stockpiling repurposable marketing assets fits an ongoing creator collaboration program, measured by the volume of usable, high-quality content it produces over time.
Each of those campaign types needs a measurement hook built in from day one, not bolted on afterward: redemption codes for the check-in campaign, UTM-tagged landing pages for the contest, tracked links for the review drive. Skip that step and the campaign might still generate content, it just won't generate any answers.
Repurposing guest content as paid creative deserves particular attention, because it's likely the single highest-leverage move available to an independent restaurant. Taking a guest's own photo or video and running it as a Meta or TikTok ad, tagged with a UTM parameter and tracked through a pixel, turns something that cost nothing to produce into a trackable paid asset with a measurable return. The content's already been shot for free; all that's missing is the tracking layer that tells the operator whether it worked.
Some UGC appears without a formal campaign at all, when plating is designed to photograph well, signage nudges guests to tag the location, and staff notice a guest filming and lean into it rather than looking annoyed. All of that produces real content, and none of it costs anything beyond attention. But it's also the hardest UGC to attribute, since there's no code and no link attached to it, unless the restaurant has some mechanism, a WiFi capture, an email collected at booking, that can eventually tie the anonymous poster back to an actual visit on the books.
Reading the results without fooling yourself
Every layer of this measurement chain produces a number, and every number invites a story about what happened. The discipline is in checking whether the story the number tells is the one actually supported by the data, rather than the one that happens to be flattering.
A spike in saves after a UGC push is a real signal, worth taking seriously as evidence of visit intent building somewhere in the funnel. A spike in likes on the same post, absent any lift in saves, comments asking about location, or promo redemptions, is not evidence of much beyond the fact that the photo looked appetizing to people scrolling past it. The difference between those two readings is the difference between a campaign that's working and a campaign that just feels like it's working, and only the measurement chain built in the sections above can tell which one an operator is actually looking at.
Attribution built this way, UTM tags, pixels, promo codes, host-stand questions, POS match-backs, will never capture every touchpoint in a guest's decision, and it shouldn't be mistaken for something more precise than it is. What it captures is enough of the picture to move a restaurant from guessing to estimating, which, at a 3% to 5% margin, is very often the difference between a marketing budget that earns its keep and one that quietly doesn't.