Customer Lifetime Value Calculation for Restaurants
Why regulars matter more to your bottom line than nightly sales reports reveal.

A regular table comes in twice a month, one of three guest types in the Restaurant Snapshot model, alongside a one-time visitor and an occasional quarterly guest, all at the same check average and gross margin, with only frequency and retention as variables. They tip well, they order the wine, and they text the host when someone's birthday is coming up. Table six redeemed a Groupon, split the entree, and will never be heard from again. On tonight's POS report, they're identical: same check total, same line item, same contribution to the night's sales figure. That's the blind spot. A restaurant that only tracks nightly sales cannot distinguish between a guest who is building the business and a guest who is passing through it once.
Restaurant Snapshot puts the problem in sharp relief: two restaurants can post identical Friday numbers, one built on discount-driven first-timers who vanish after redemption, the other on regulars who return twice a month, tip more, and bring friends. The nightly total has no way to tell those two businesses apart, even though one of them is compounding in value and the other is treading water on a discount code. CLV is the metric that can tell those two restaurants apart, and it is the only starting point from which acquisition costs, retention investments, and channel ROI can be rationally evaluated. The rest of this piece builds that number from its parts, runs it through a worked example, and follows it out to the budget decisions it's supposed to govern.
How customer lifetime value multiplies its inputs
CLV answers a different question than tonight's sales report does. Instead of asking what came through the door today, it asks what a given guest is worth across the entire span of their relationship with the restaurant, from the first plate to the last. The standard formula, as used by Restaurant Snapshot, multiplies average check, visits per year, average retention in years, and gross margin. Every one of those inputs is already sitting in an operator's existing systems. Average check comes off the POS. Visit frequency comes from loyalty software or reservation data. Retention comes from tracking how long a guest keeps returning before going dark. Gross margin comes from the food-cost accounting a restaurant is already doing for entirely different reasons.
What matters more than any single input is the fact that the formula multiplies rather than adds. A restaurant that gets that same guest to visit twice as often has done something structurally different: that higher frequency now applies across the guest's entire retention period and against the full margin on every visit, so the gain compounds rather than accumulates. One might argue a dollar is a dollar regardless of which input produced it, and on a single visit, that's true. CLV measures the product of several years of visits. It's measuring the product of several years of visits, and a change to any one factor ripples through all the others multiplicatively rather than sitting in its own column.
It's also worth being precise about where CLV varies by restaurant type before comparing numbers across segments. Paytronix notes that fine dining tends to see fewer visits per year but a much higher average check and a longer customer lifespan, while quick-service restaurants see the opposite: frequent visits, lower average order value. Loman calculates CLV as average monthly spend divided by monthly churn rate, a useful shortcut when churn data is already on hand that produces numbers mathematically consistent with the longer version. But the shortcut doesn't change the underlying logic. Because the formula multiplies, the input furthest below its potential produces the largest gain when it improves, and for most restaurants, that input is visit frequency, not average check. A guest who already spends generously per visit has limited room to spend more; a guest who visits twice a year has enormous room to visit six times.
Running the numbers: a worked example operators can copy with their own inputs
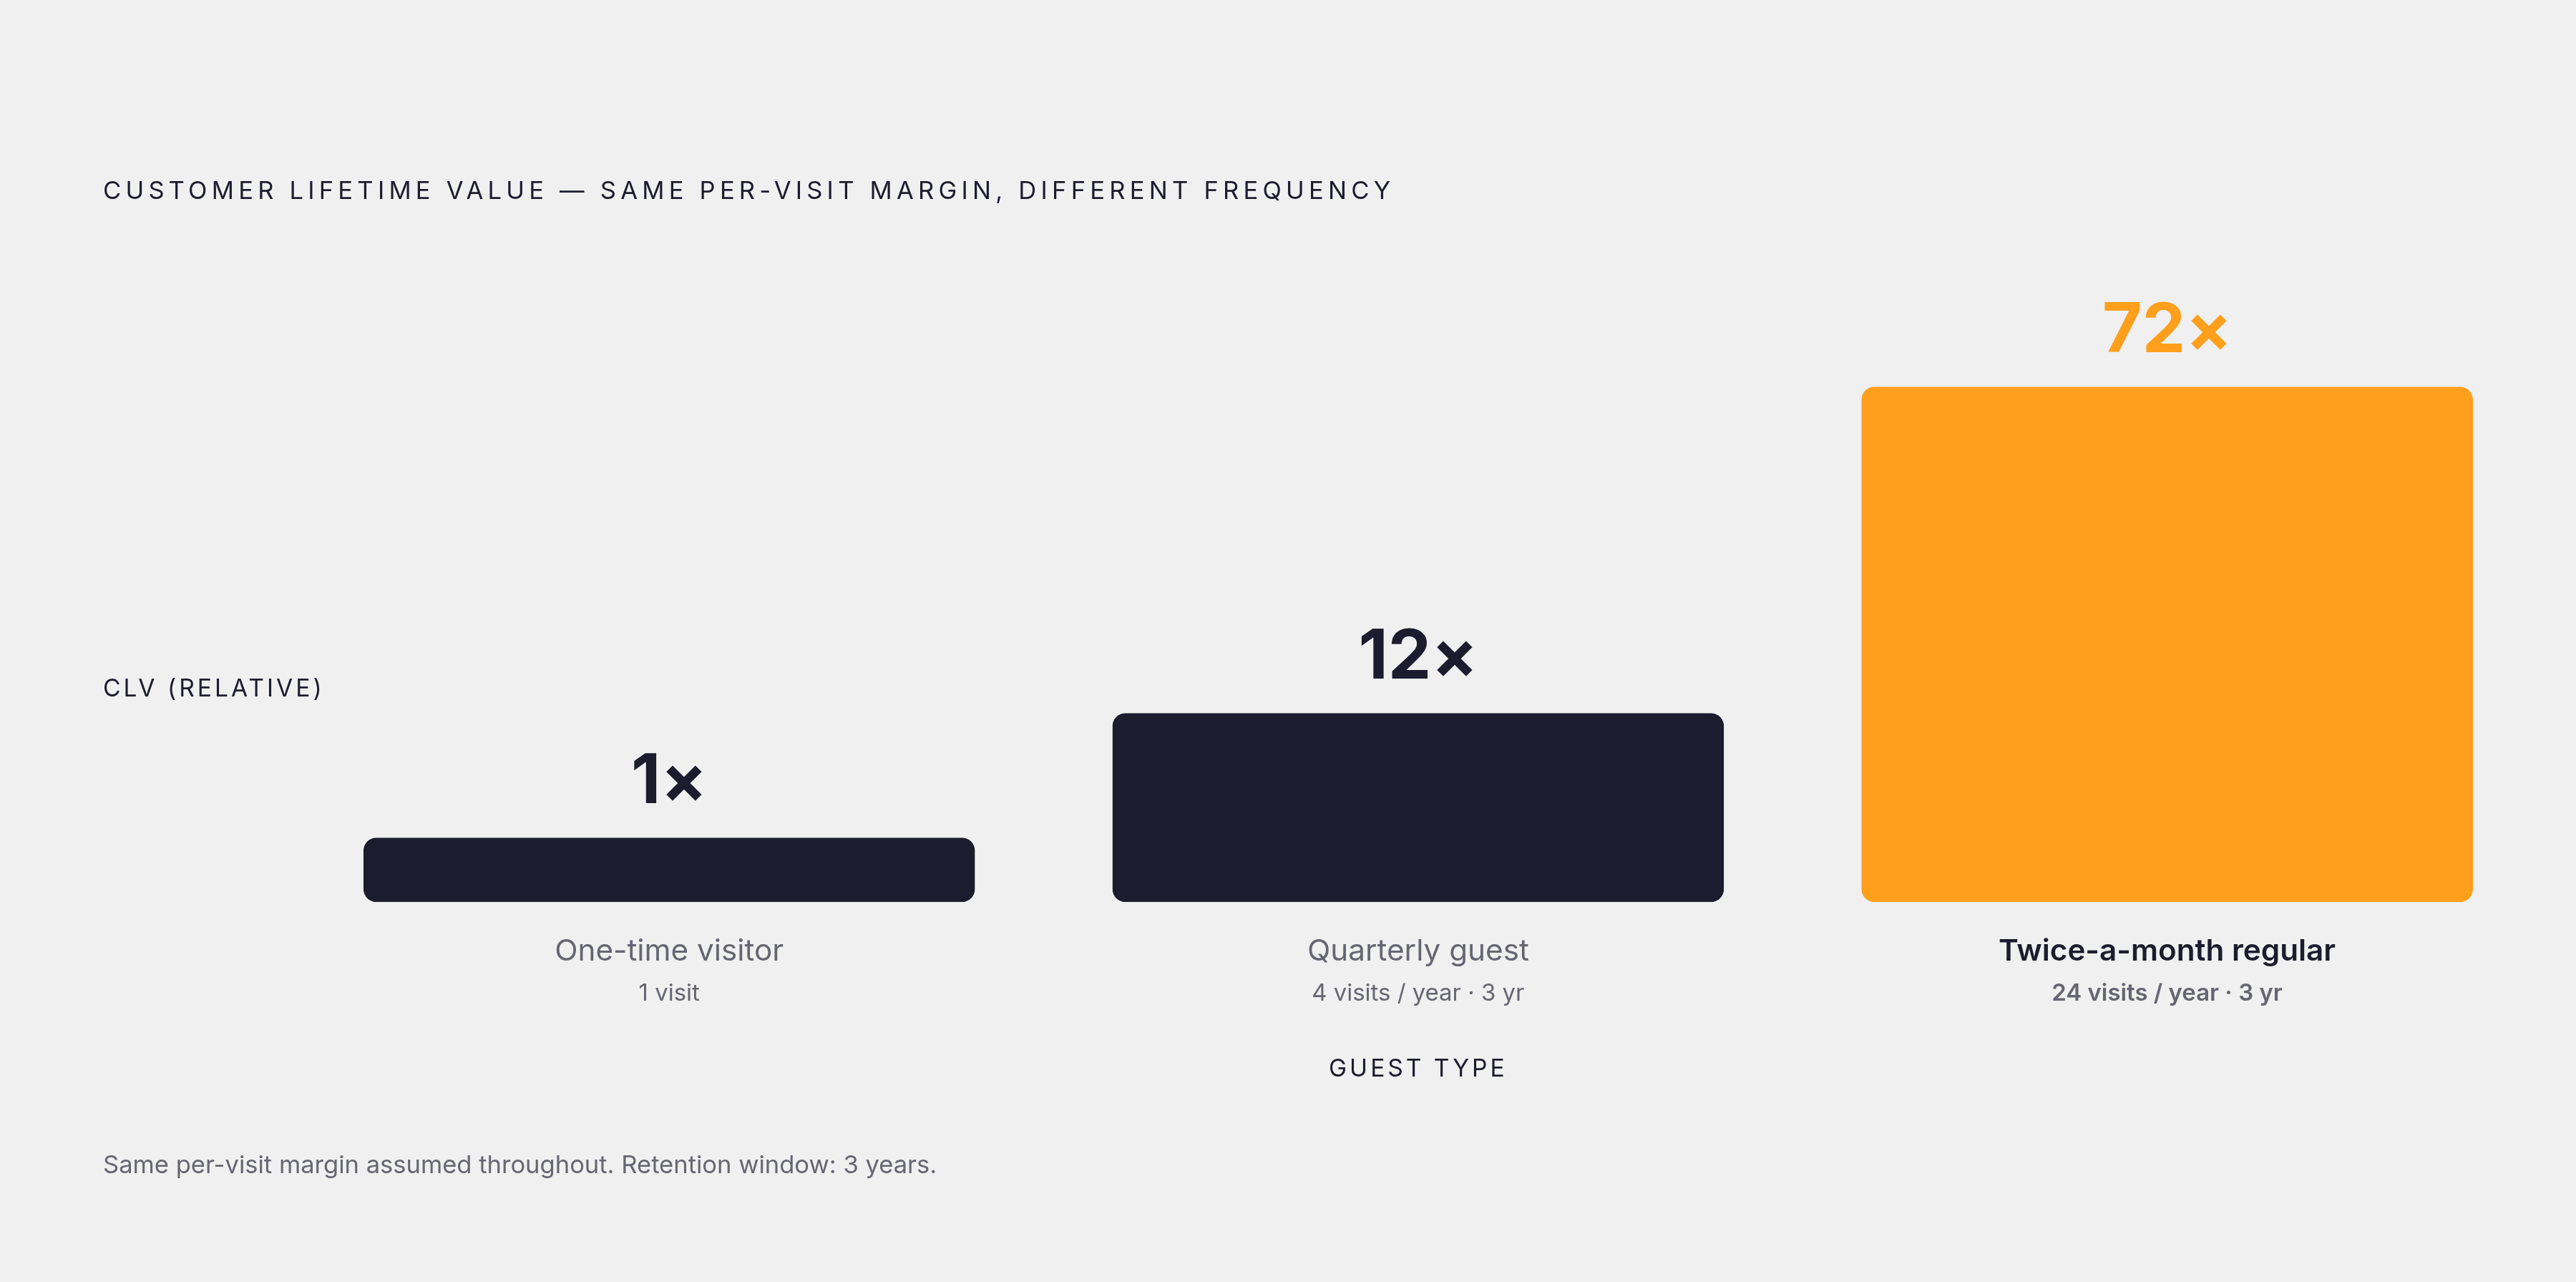
Pull three guest profiles from the same restaurant, keep average check and gross margin identical across all three, and change only how often each guest visits and how long they remain a customer. Restaurant Snapshot's model uses exactly this setup, comparing a one-time visitor, an occasional guest who returns quarterly, and a regular who comes in twice a month. Holding check size and margin constant isolates the two inputs that actually move: frequency and retention.
Grab a notebook, or the calculator app already open on the phone, because this is meant to be run with real numbers rather than read past. Pull the average check straight from the POS. Visits per year comes from loyalty program data if a program exists, from reservation system history if it doesn't, or from a reasonable survey-based estimate if neither is available.
Running the one-time visitor produces one visit, no retention period to speak of, and an output that is just that single check times margin. Running the quarterly guest across a couple of years of retention pushes the total up by more than the simple frequency difference would suggest, because the higher visit count now compounds against a multi-year retention window rather than a single transaction. Then the twice-a-month regular, run across the same retention window, moves the number again, sharply, because frequency has jumped from four visits a year to twenty-four. None of these guests needed to spend a dollar more per visit to produce that gap. The difference comes from frequency and retention, the two inputs a nightly sales report cannot see, since it only ever looks at one night at a time.
The exact multiples matter less here than the shape of the curve: modest increases in how often a guest returns, sustained over a longer retention period, produce a lifetime value gain that is multiplied rather than added. That's the argument the next three sections build on, first for where marketing dollars should go, then for how much a restaurant can rationally afford to spend acquiring a customer, and finally for why retention beats acquisition on the arithmetic alone.
CLV gaps between guest segments and marketing spend
It's a distribution, and the gap between the top of that distribution and the bottom is itself information an operator can act on. An operator who knows which guest segments produce the highest lifetime value can stop spreading marketing dollars evenly across the whole guest base and start concentrating them where the return is actually largest.
KitchenNmbrs' analysis found dinner customers deliver 40 to 60% higher CLV than lunch customers, and parties of four or more generate higher average checks than smaller tables, both of which point toward the same conclusion: marketing dollars aimed at the highest-CLV segments produce a better return than dollars spread evenly across all segments. A small share of regulars at the guest level can drive a disproportionately large share of a restaurant's total orders, and a guest who visits four or more times a year is worth roughly six times the annual revenue of someone who visits once. That's a six-to-one gap sitting inside a guest base that a nightly sales report renders as one undifferentiated total.
Paytronix offers a set of concrete ways to carve that guest base into segments worth measuring separately: geography, using geofencing around the restaurant's trade area; past visit behavior; occasion triggers like birthdays; and dietary preferences. Each of those cuts produces a distinct CLV profile. An operator running the calculation across segments ends up with something closer to a ranked list than a single average: which guest types to actively acquire more of, which are worth retaining even at a higher cost, and which acquisition channels are worth prioritizing based on the quality of guest they bring in rather than the raw count. That ranked list turns segmentation into a budget allocation tool, the thread the next section picks up directly.
How CLV sets a ceiling on customer acquisition spending
A CLV figure only becomes useful as a budgeting tool once it's set against the cost of acquiring the customer it describes. That ratio, Customer Acquisition Cost measured against CLV, is the guardrail that separates a disciplined marketing budget from a guess dressed up as a strategy.
KitchenNmbrs provides the benchmark: operators who limit Customer Acquisition Cost to 20-30% of CLV maintain healthier cash flow and profitability. That range converts directly into a ceiling, a maximum an operator can justify spending per campaign, per channel, and per new customer acquired, once the CLV for the relevant segment is known. And because CLV moves with segment, so does the ceiling: if dinner regulars carry a substantially higher CLV than lunch drop-ins, the restaurant can rationally spend more to acquire a dinner guest than a lunch guest, and the math, not a hunch, is what justifies the gap.
Without that number, CAC decisions default to something closer to instinct. Operators set next month's ad budget based on what got spent last month, what a competitor down the street appears to be doing, or whatever a platform sales rep recommends, none of which has any connection to what the customer being acquired is actually worth. TastyIgniter's broader budget framework is useful context here: established restaurants tend to allocate a small single-digit share of total revenue to marketing, with newer restaurants allocating somewhat more. Those percentages function as starting guardrails, and the CLV-anchored, per-customer math is what tells an operator whether a specific campaign is actually worth running.
There's an accounting trap hiding inside CAC calculations that's easy to miss. OpenTable points out that a true marketing ROI figure has to account for every cost involved, discounts, labor, food cost, delivery platform fees, not just the ad spend line. A free entree promotion that looks like it "filled seats" for the night may, once the discount and the food cost and the platform fee are all counted, have acquired those customers at a cost that exceeds what they'll ever be worth. If a restaurant doesn't know its CLV, on what basis is it deciding what a new customer is worth paying for in the first place?
Why retention marketing beats acquisition on CLV per dollar
The multiplicative structure of the CLV formula has a direct consequence for how a marketing dollar should be spent: because frequency and retention multiply against each other and against the guest's full margin over time, getting an existing guest to return one more time produces a larger CLV gain than spending the same dollar to acquire a brand-new one-time visitor.
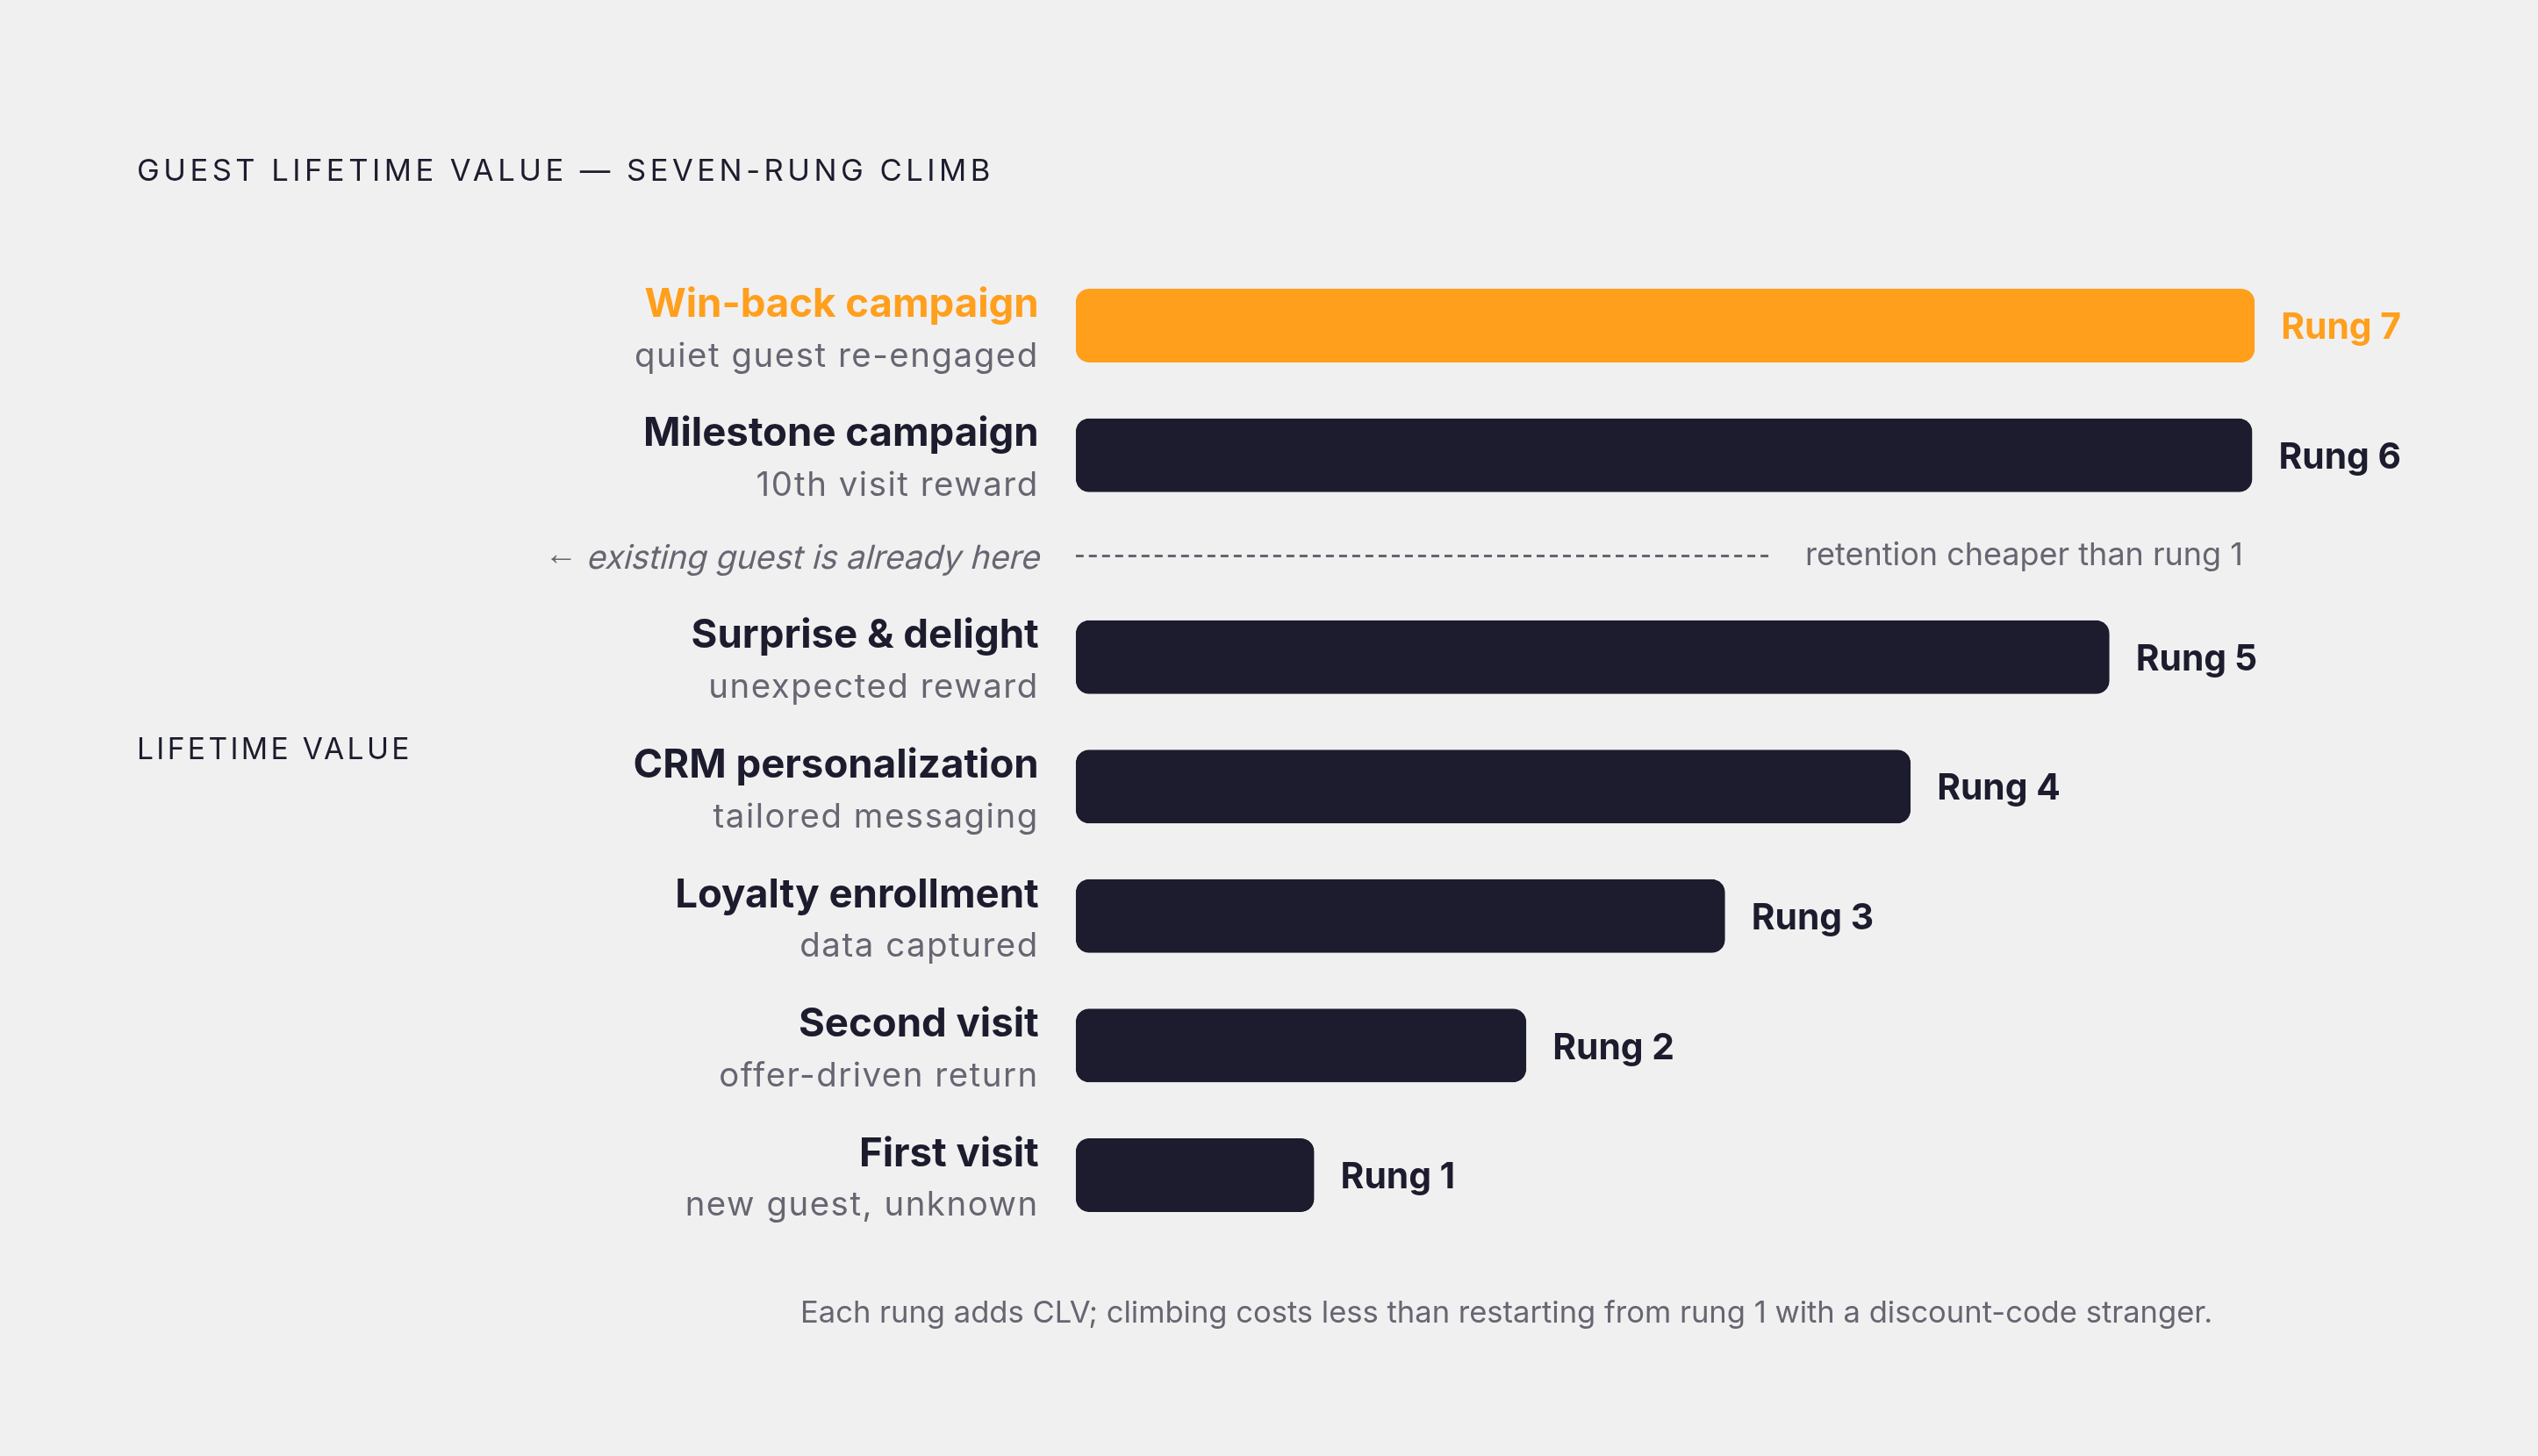
The mechanism is structural: a newly acquired customer starts at the very bottom of the CLV curve, with a first visit, no relationship on file, and no loyalty data to work from. A guest who's already been retained is partway up that curve already, with known preferences, an established visit pattern, and a lower cost to bring back for one more visit. Paytronix maps that climb as a sequence: a first visit, a second visit via an offer, loyalty enrollment, CRM personalization, a surprise-and-delight moment, an automated milestone campaign around something like a tenth visit, and a win-back campaign if the guest goes quiet. Each rung on that ladder raises the guest's lifetime value, and climbing one more rung costs less than starting an entirely new ladder from a stranger who just redeemed a discount code.
Loyalty programs are the most documented version of this mechanism in practice. Restaurant Velocity reports that guests enrolled in a loyalty program visit more often and spend more per check than guests who aren't enrolled. Because frequency and average check multiply together in the CLV formula, a program that raises both at once produces a compounded gain, and enrolled guests end up with a much larger CLV figure than everyone else. The argument isn't for loyalty programs as a feel-good retention gesture, but one built directly from the arithmetic already established in this piece, that a dollar spent nudging an existing guest up the ladder outperforms a dollar spent finding a brand-new one.
The four levers that move CLV
Every improvement to CLV has to run through one of exactly four inputs: average check, visit frequency, customer retention, and gross margin. Knowing this turns CLV from a diagnostic number into an operational punch list, because each lever maps to a specific set of tactics an operator can actually execute.
Average check is the lever most restaurants reach for first, because it's the most visible and the easiest to act on in the short term. Loman and Paytronix both point to upselling and cross-selling as the core tactics: premium menu items, suggested add-ons, pricier specials pitched at the table. Paytronix identifies a quieter mechanism: guests tend to spend meaningfully more when paying by card than by cash, so reducing friction at the point of payment is itself a small but real AOV lever. But average check has a ceiling. A guest's spend per visit is bounded by what their segment is willing to pay for a given occasion, and no amount of upselling turns a lunch guest into a guest paying dinner-tasting-menu prices. Frequency and retention don't share that ceiling, so they carry more long-run weight in the formula.
Visit frequency is the highest-leverage input precisely because it multiplies against both retention and margin at once, and it's the lever most operators underuse relative to its payoff. The tactics here have documented mechanisms behind them rather than being generic loyalty talk: loyalty program members visit roughly 20% more often than non-members, according to data from Paytronix, Talon.One, and Restroworks, and that frequency lift compounds through the rest of the formula rather than sitting on its own. Re-engagement campaigns targeted at days-since-last-visit data, and offers personalized to a guest's past ordering behavior, are the operational tools that move this specific lever.
Retention and gross margin round out the set, and both deserve the same scrutiny as average check and frequency rather than being treated as background conditions a restaurant simply inherits. Retention is the guest's tenure, how long they keep returning before going dark, and every tactic already discussed under the CLV growth ladder, from loyalty enrollment through win-back campaigns, is fundamentally a retention tool even when it gets marketed as something else. Gross margin sits closer to the kitchen and the supply chain than to the marketing calendar, but because it multiplies against every other input, a percentage point gained on food cost raises CLV the same way a percentage point gained on visit frequency does. None of the four levers works in isolation. They're the same four numbers that built the formula in the first section of this piece, and every tactic a restaurant runs, from a loyalty app to a winback email to a menu redesign, is ultimately an attempt to move one of them.
Sources
- Boost Customer Lifetime Value Restaurant Profits 50%
- Calculate Restaurant Customer Lifetime Value | Loman
- Restaurant Customer Lifetime Value: How to Calculate It (and Double It) | Restaurant Snapshot for GHL
- How do I calculate customer lifetime value as input for... | Complete guide 2026
- Calculating restaurant marketing ROI: 4 top metrics to track
- Where Should Restaurant Owners Invest Their Marketing Budget in 2026?