Setting a Paid Advertising Budget for a Single Location Restaurant
Start with actual covers you need and what acquiring them can cost—not a percentage of revenue.

A single-location restaurant that budgets its advertising as a flat percentage of revenue is answering the wrong question with the wrong math. The rule appears in nearly every page-one guide to restaurant marketing, usually as a tidy range of single-digit percentages, and it functions as a constraint check: a ceiling on spend relative to the size of the business. It was never built to tell an operator whether that spend can return a profit, and that distinction is the whole problem with using it as a starting point.
The rule assumes three things are already true: base revenue is trending upward, the trade area is stable, and the operator is actually deploying the budget with some discipline. A restaurant with a shrinking trade area and a substantial share of revenue allocated to marketing is paying a toll to stand still.
The deeper flaw is that a percentage of revenue ignores profitability entirely, treating compliance with a spending ceiling as if it were evidence of a return. A percentage of revenue says nothing about the cost of acquiring the customer who generates that revenue. Compliance with a budgeting convention and profitability are two different outcomes, and the rest of this piece is built around a method that tests for the second one directly.
The two numbers every budget must start from: covers target and CAC ceiling
Replace the percentage with two numbers that can actually be tested against each other before a dollar gets spent: a covers target and a customer acquisition cost ceiling. Together they give an operator a concrete pass-fail test for whether a marketing plan can pay for itself, which a percentage of revenue can never do.
Start with the covers target. This is a specific count, not a mood. "More business" is not a target; "60 net new covers from first-time or lapsed guests this month" is. Picking a number forces the rest of the math to follow.
The second number, the CAC ceiling, comes from the restaurant's own gross margin per cover, not from what a competitor spends or what an agency recommends as a benchmark. The formula is simple: CAC ceiling equals gross margin per cover multiplied by the number of return visits the operator is willing to wait for payback. Spend more than that to acquire a single cover, and the math cannot break even at that visit frequency, no matter how good the campaign looks on a dashboard.
The third step is multiplication. Covers target times CAC ceiling equals the maximum budget the math will actually support. That number becomes the plan. The percentage-of-revenue figure still has a role, but it moves to the back seat: a sanity check that catches a wildly unrealistic number after the covers-and-CAC math has already set the plan.
The honest return on a paid ad
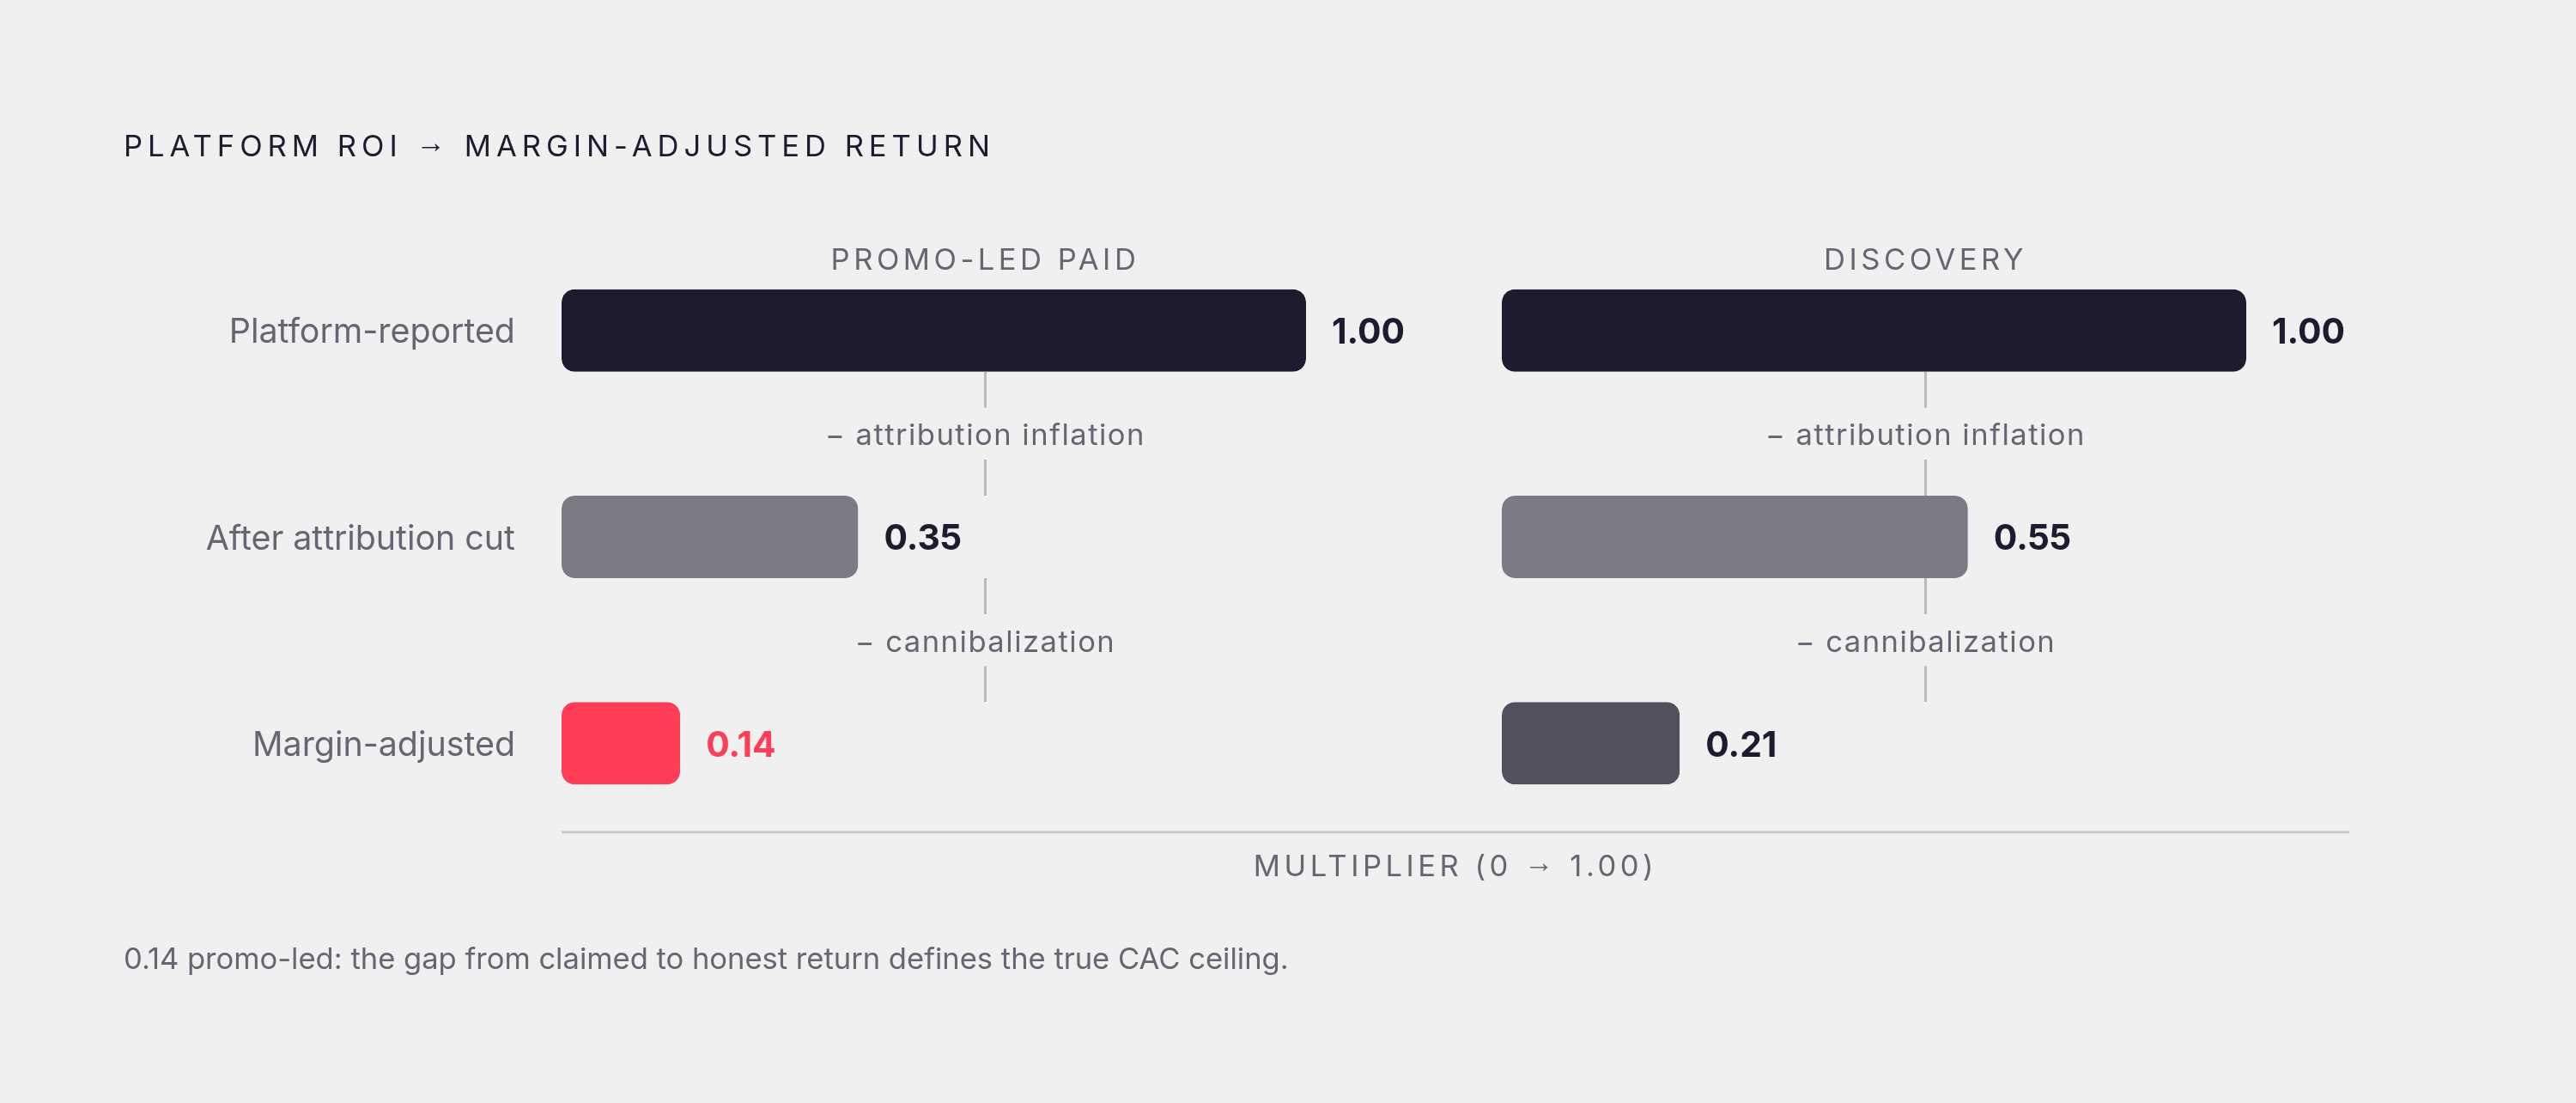
None of this math works if you set the CAC ceiling against the return figures ad platforms report, because every published platform return overstates actual profit by a factor of five to seven. An operator who plugs a dashboard ROAS number into the covers-and-CAC formula is building a budget on a number that was already dishonest.
Three haircuts apply to any published marketing ROI figure, and understanding them is what separates a credible CAC ceiling from a hopeful one.
The attribution haircut comes first. When independent checks test platform-reported conversion data, the numbers come in well below what the dashboard claims.
The second haircut concerns cannibalization. Discount-led campaigns often pull from guests who were regulars anyway, so a redeemed offer is only worth its full face value if the guest genuinely would not have shown up without it. Unbranded search and local creator content, the discovery channels that reach people who were not already customers, hold much closer to their full stated value, because they bring in new demand on top of existing demand.
When you combine the haircuts, the honest multiplier for a promo-led paid campaign comes out around 0.14. For a discovery channel it lands closer to 0.21. The platform did not misrank the channels relative to each other. It misstated the size of the return by a wide margin, and that distinction matters enormously for anyone setting a ceiling based on the number.
The practical cost of skipping this step is predictable. The CAC ceiling has to be built on margin-adjusted, haircut-adjusted returns. If you build on gross platform numbers, you are building toward a budget cut that arrives on schedule, every time.
The budget-from-covers method at a real spending level
When you put real numbers against the method, the shape of a single-location paid advertising budget becomes recognizable fast. Picture an independent restaurant that brings in a representative level of annual revenue, with a covers target and CAC ceiling worked out using the formula above. The covers-and-CAC math typically produces a monthly paid budget that is near the floor most ad platforms need to function, so it helps to know that before you set expectations.
A line often missing from restaurant marketing budgets deserves its own name: call it the marketing tax. This is the share of total marketing spend that goes to loyalty redemptions, review management subscriptions, and small recurring vendor fees. None of it appears in a campaign performance report, and all of it drains the account every single month regardless of whether a single ad ran.
So the covers-and-CAC math tells an operator where to sit inside their realistic spending range. If the covers target requires more budget than the CAC ceiling can support, the fix is not to raise the ceiling to match the ambition. The fix is to lower the covers target, extend the payback window, or find a cheaper acquisition channel, because the ceiling is the number the margin actually supports and the target is the number that has to bend.
Allocating the paid budget across Google, Meta, and TikTok
Once the total budget is set, the allocation question comes down to a single test applied to each channel: can it deliver a cover inside the CAC ceiling? That test, not platform popularity or personal preference, decides the split.
Google captures existing intent. A diner who has already decided to go out and is choosing where to go is the highest-intent audience in the entire funnel, and local search campaigns built around "near me," cuisine type, and occasion queries reach that person directly. Cost per reservation on search tends to run meaningfully lower than on display advertising, so display budget is better reserved for retargeting people who have already shown interest.
Meta works earlier in the funnel and does double duty: it creates demand among people who were not thinking about the restaurant at all, and it retargets people who have interacted with it before. The funnel stages matter here. Reels handle awareness, carousels handle menu consideration, and lead ads handle reservation capture. Three levers matter most for a single location running Meta: a tight geographic radius so spend reaches people who will actually visit, a budget sufficient to let the algorithm calibrate before learning stops, and UGC-style food video that looks like something a guest shot on their phone. Ad prices on Meta have been rising year-over-year as the volume of impressions delivered across the platform has grown, so creative quality and audience targeting precision carry more weight than they did two years ago.
The split itself depends on where the restaurant stands. An established location with an existing guest list can run a roughly even split between Google and Meta, balancing intent capture against retargeting built from people who already know the place. Google becomes more productive later, once the brand is actually searchable by name.
One detail catches new operators off guard: a tight geographic radius means the same handful of people see the same ad repeatedly within days, so creative fatigue arrives faster for a single location than it does for a national brand. If you plan creative refresh around the actual size of the local audience, instead of a generic campaign calendar built for a much larger market, the ads will not go stale before the budget period ends. An unmanaged account compounds this problem quietly: broad-match search terms and clicks from outside the delivery radius leak spend every single month, and the leak is fixable the moment someone goes looking for it.
Acquisition spending, the leaky bucket it creates, and where retention fits in the budget
All the acquisition math from the earlier sections rests on an assumption that needs to be stated directly: most first-time guests do not come back on their own. Without a deliberate follow-up system, the CAC spent to acquire that guest is a complete loss the moment they walk out the door, regardless of how carefully the ceiling was calculated.
The gap between the cost of acquiring a new cover and the cost of reactivating a guest who has already visited once is large. The guest already knows the place exists.
Loyalty program automation tied into the point-of-sale system closes the loop that acquisition spend alone cannot close on its own. It connects the original acquisition channel to whether that guest actually returned, which lets an operator calculate lifetime value by acquisition source and finally answer the question the CAC ceiling was built to ask: was this campaign's cost per cover actually acceptable once repeat visits are counted?
That changes what counts as an acceptable ceiling. So a lower CAC ceiling becomes affordable, even generous, once retention is doing real work to pull lifetime value upward. A restaurant with no retention system has to treat every acquired cover as a one-time transaction and set its ceiling accordingly, which is a much stingier number than the one available to an operator with retention infrastructure in place.
Local creator partnerships as a lower-CAC acquisition channel for single locations
Local creator partnerships deserve a place in the budget for a plain reason: a creator with a geographically concentrated local following can deliver a new cover at a cost that fits inside a CAC ceiling that Meta or Google alone often cannot clear once the haircuts from earlier are applied.
Follower count is the wrong variable to sort creators by. Audience location is the one that matters. A creator with a small following that all lives within ten miles of the restaurant is worth more to that restaurant than a creator with a much larger following scattered across a continent, because the second creator is mostly reaching people who will never physically sit at a table.
The break-even math for a gifting deal is concrete. A restaurant with a $65 average check size needs a local creator to drive roughly 5 to 10 covers to break even on a $350 cash deal. Raising the average check size drops the threshold sharply, so a single well-attended table can make a comparable cash deal profitable.
Attribution here is about as clean as restaurant marketing gets. If you assign each creator a unique promo code, you know exactly which creator drove which redemption, so you can rank creators against each other using actual redemption counts rather than engagement metrics that never touch a receipt.
If you run a modest monthly marketing budget, creator spend does not need to dominate the plan to be worthwhile. A small allocation, enough for two or three nano partnerships or one solid micro-creator collaboration per month, can be a genuinely productive line rather than a trend an operator feels obligated to chase.
Connecting spend to in-store revenue
Every number built up through this method, the covers target, the CAC ceiling, the channel splits, the retention allocation, the creator deals, is only as good as the operator's ability to measure whether it actually filled a table. Most restaurant marketing setups have a structural gap right at that measurement point: ad platforms report clicks and modeled conversions, the point-of-sale system reports revenue, and in a default setup nothing connects the two. Wasted spend can look like a success on a platform dashboard while the covers it claims to have generated never actually walked through the door.
Media Efficiency Ratio offers a way around that gap because it works independently of platform tracking.
A few attribution methods can close the remaining distance between digital exposure and an actual seated guest. Unique promo codes assigned per campaign or per creator, redeemable directly at the point of sale, give the most direct one-to-one link between a specific ad and a specific cover. UTM-tagged links placed on every social post and email, feeding into Google Analytics 4, track reservation and online-order attribution with more precision than guesswork allows. Asking guests directly at the host stand how they heard about the restaurant is low-tech, costs nothing, and produces first-party data that no platform can claim credit for or charge a fee to access. If first-party data systems match email addresses or phone numbers collected through reservations, WiFi logins, or online ordering against point-of-sale transactions, an operator can calculate guest lifetime value by acquisition source, which is the exact number the CAC ceiling was built to compare against.
Platform store visit tools exist too. Meta offers one if a business qualifies with multiple store locations added to Facebook, and Google offers one if a business meets its eligibility requirements around verified locations and sufficient ad activity. Both tools are directional rather than exact: useful as a rough baseline for how an ad might be influencing foot traffic, not reliable enough to serve as the source of truth for a CAC calculation. The covers target, the CAC ceiling, and the revenue the restaurant actually books at the point of sale remain the numbers worth trusting.